HSBC 2012 Annual Report Download - page 129
Download and view the complete annual report
Please find page 129 of the 2012 HSBC annual report below. You can navigate through the pages in the report by either clicking on the pages listed below, or by using the keyword search tool below to find specific information within the annual report.-
 1
1 -
2
-
3
-
4
-
5
-
6
-
7
-
8
-
9
-
10
-
11
-
12
-
13
-
14
-
15
-
16
-
17
-
18
-
19
-
20
-
21
-
22
-
23
-
24
-
25
-
26
-
27
-
28
-
29
-
30
-
31
-
32
-
33
-
34
-
35
-
36
-
37
-
38
-
39
-
40
-
41
-
42
-
43
-
44
-
45
-
46
-
47
-
48
-
49
-
50
-
51
-
52
-
53
-
54
-
55
-
56
-
57
-
58
-
59
-
60
-
61
-
62
-
63
-
64
-
65
-
66
-
67
-
68
-
69
-
70
-
71
-
72
-
73
-
74
-
75
-
76
-
77
-
78
-
79
-
80
-
81
-
82
-
83
-
84
-
85
-
86
-
87
-
88
-
89
-
90
-
91
-
92
-
93
-
94
-
95
-
96
-
97
-
98
-
99
-
100
-
101
-
102
-
103
-
104
-
105
-
106
-
107
-
108
-
109
-
110
-
111
-
112
-
113
-
114
-
115
-
116
-
117
-
118
-
 119
119 -
 120
120 -
 121
121 -
 122
122 -
 123
123 -
 124
124 -
 125
125 -
 126
126 -
 127
127 -
 128
128 -
 129
129 -
 130
130 -
 131
131 -
 132
132 -
 133
133 -
 134
134 -
 135
135 -
 136
136 -
 137
137 -
 138
138 -
 139
139 -
140
-
141
-
142
-
143
-
144
-
145
-
146
-
147
-
148
-
149
-
150
-
151
-
152
-
153
-
154
-
155
-
156
-
157
-
158
-
159
-
160
-
161
-
162
-
163
-
164
-
165
-
166
-
167
-
168
-
169
-
170
-
171
-
172
-
173
-
174
-
175
-
176
-
177
-
178
-
179
-
180
-
181
-
182
-
183
-
184
-
185
-
186
-
187
-
188
-
189
-
190
-
191
-
192
-
193
-
194
-
195
-
196
-
197
-
198
-
199
-
200
-
201
-
202
-
203
-
204
-
205
-
206
-
207
-
208
-
209
-
210
-
211
-
212
-
213
-
214
-
215
-
216
-
217
-
218
-
219
-
220
-
221
-
222
-
223
-
224
-
225
-
226
-
227
-
228
-
229
-
230
-
231
-
232
-
233
-
234
-
235
-
236
-
237
-
238
-
239
-
240
-
241
-
242
-
243
-
244
-
245
-
246
-
247
-
248
-
249
-
250
-
251
-
252
-
253
-
254
-
255
-
256
-
257
-
258
-
259
-
260
-
261
-
262
-
263
-
264
-
265
-
266
-
267
-
268
-
269
-
270
-
271
-
272
-
273
-
274
-
275
-
276
-
277
-
278
-
279
-
280
-
281
-
282
-
283
-
284
-
285
-
286
-
287
-
288
-
289
-
290
-
291
-
292
-
293
-
294
-
295
-
296
-
297
-
298
-
299
-
300
-
301
-
302
-
303
-
304
-
305
-
306
-
307
-
308
-
309
-
310
-
311
-
312
-
313
-
314
-
315
-
316
-
317
-
318
-
319
-
320
-
321
-
322
-
323
-
324
-
325
-
326
-
327
-
328
-
329
-
330
-
331
-
332
-
333
-
334
-
335
-
336
-
337
-
338
-
339
-
340
-
341
-
342
-
343
-
344
-
345
-
346
-
347
-
348
-
349
-
350
-
351
-
352
-
353
-
354
-
355
-
356
-
357
-
358
-
359
-
360
-
361
-
362
-
363
-
364
-
365
-
366
-
367
-
368
-
369
-
370
-
371
-
372
-
373
-
374
-
375
-
376
-
377
-
378
-
379
-
380
-
381
-
382
-
383
-
384
-
385
-
386
-
387
-
388
-
389
-
390
-
391
-
392
-
393
-
394
-
395
-
396
-
397
-
398
-
399
-
400
-
401
-
402
-
403
-
404
-
405
-
406
-
407
-
408
-
409
-
410
-
411
-
412
-
413
-
414
-
415
-
416
-
417
-
418
-
419
-
420
-
421
-
422
-
423
-
424
-
425
-
426
-
427
-
428
-
429
-
430
-
431
-
432
-
433
-
434
-
435
-
436
-
437
-
438
-
439
-
440
-
441
-
442
-
443
-
444
-
445
-
446
-
447
-
448
-
449
-
450
-
451
-
452
-
453
-
454
-
455
-
456
-
457
-
458
-
459
-
460
-
461
-
462
-
463
-
464
-
465
-
466
-
467
-
468
-
469
-
470
-
471
-
472
-
473
-
474
-
475
-
476
-
477
-
478
-
479
-
480
-
481
-
482
-
483
-
484
-
485
-
486
-
487
-
488
-
489
-
490
-
491
-
492
-
493
-
494
-
495
-
496
-
497
-
498
-
499
-
500
-
501
-
502
-
503
-
504
-
505
-
506
-
507
-
508
-
509
-
510
-
511
-
512
-
513
-
514
-
515
-
516
-
517
-
518
-
519
-
520
-
521
-
522
-
523
-
524
-
525
-
526
-
527
-
528
-
529
-
530
-
531
-
532
-
533
-
534
-
535
-
536
-
537
-
538
-
539
-
540
-
541
-
542
-
543
-
544
-
545
-
546
 |
 |

127
Overview Operating & Financial Review Corporate Governance Financial Statements Shareholder Information
component of our risk management framework. It
is central to the annual planning process, in which
global businesses, geographical regions and
functions are required to articulate their risk
appetite statements. These are aligned with Group
strategy, and provide a risk profile of each global
business, region or function in the context of the
risk categories discussed above.
Quantitative and qualitative metrics are assigned
to nine key categories: earnings, capital, liquidity
and funding, securitisations, cost of risk, intra-group
lending, strategic investments, risk categories and
risk diversification and concentration. Measurement
against the metrics:
• guides underlying business activity, ensuring
it is aligned to risk appetite statements;
• informs risk-adjusted remuneration;
• enables the key underlying assumptions to be
monitored and, where necessary, adjusted
through subsequent business planning cycles;
and
• promptly identifies business decisions needed
to mitigate risk.
Some of the core metrics that are measured,
monitored and presented to the Board monthly are
tabulated below:
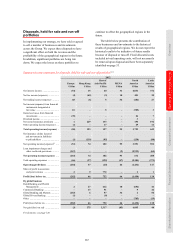
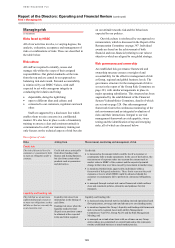
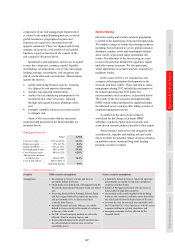
Risk appetite metrics
Target Actual
Core tier 1 ratio ........... 9.5% to 10.5% 12.3%
Return on equity ......... 12% to 15% 8.4%
Return on RWAs ........ 1.8% to 2.6% 1.8%
Dividend payout ratio . 40% to 60% 55.4%
Cost efficiency ratio ... 48% to 52% 62.8%
Advances to customer
accounts ratio........... Below 90%
74.4%
Cost of risk (LICs) ...... Below 20% of
operating income
9.9%
Stress testing
Our stress testing and scenario analysis programme
is central to the monitoring of top and emerging risks.
We conduct a range of Group stress-testing scenarios
including, but not limited to, severe global economic
downturn, country, sector and counterparty failures
and a variety of projected major operational risk
events. The outcomes of the stress testing are used
to assess the potential demand for regulatory capital
under the various scenarios. We also participate,
where appropriate, in scenario analyses requested by
regulatory bodies.
In the course of 2012, we examined several
scenarios reflecting potential developments in the
eurozone and more widely. Those reported to senior
management during 2012 included an assessment of
the annual operating plan 2012 under two
macroeconomic stress scenarios, as described below.
The results of the two scenarios demonstrated that
HSBC would remain satisfactorily capitalised under
the mild and severe scenarios after taking account of
assumed management actions.
In addition to the suite of risk scenarios
considered for the Group, each major HSBC
subsidiary conducts regular macroeconomic and
event-driven scenario analyses specific to their region.
Stress testing is used across risk categories such
as market risk, liquidity and funding risk and credit
risk to evaluate the potential impact of stress scenarios
on portfolio values, structural long-term funding
positions, income or capital.
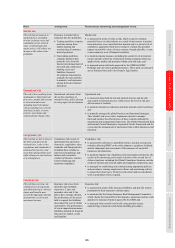
Stress scenario assumptions
Scenario Mild scenario assumptions Severe scenario assumptions
Assumptions
• the situation in Greece worsens and there is
an orderly default in Greece;
• Greek banks also default and, with support from the
EU and the International Monetary Fund, are bailed
out;
• increasing bond yields in Portugal, Ireland, Spain
and Italy trigger further fiscal austerity measures,
and governments strive to disassociate their
countries from Greece;
• through financial and trade linkages, an orderly
default in Greece results in the spread of contagion
to the rest of the world;
• the UK, US and emerging markets are adversely
affected, albeit to varying degrees; and
• slower global demand curbs growth and increases
the risk premium on interest rates as well as
commodity prices.
• a disorderly default in Greece, where the eurozone
governments are unable to ring-fence peripheral
countries and their banks;
• default of Portugal and Ireland with increases in
bond yields for high debt countries;
• the ensuing credit crunch together with declining
business and consumer confidence more than offset
any relief gained from the depreciation of the euro;
• investors become increasingly uncomfortable with
the US and the UK’s fiscal positions, with the severe
scenario resulting in a global slowdown; and
• emerging economies are less affected by the
financial shock.