HSBC 2012 Annual Report Download - page 44
Download and view the complete annual report
Please find page 44 of the 2012 HSBC annual report below. You can navigate through the pages in the report by either clicking on the pages listed below, or by using the keyword search tool below to find specific information within the annual report.-
 1
1 -
2
-
3
-
4
-
5
-
6
-
7
-
8
-
9
-
10
-
11
-
12
-
13
-
14
-
15
-
16
-
17
-
18
-
19
-
20
-
21
-
22
-
23
-
24
-
25
-
26
-
27
-
28
-
29
-
30
-
31
-
32
-
33
-
 34
34 -
 35
35 -
 36
36 -
 37
37 -
 38
38 -
 39
39 -
 40
40 -
 41
41 -
 42
42 -
 43
43 -
 44
44 -
 45
45 -
 46
46 -
 47
47 -
 48
48 -
 49
49 -
 50
50 -
 51
51 -
 52
52 -
 53
53 -
 54
54 -
55
-
56
-
57
-
58
-
59
-
60
-
61
-
62
-
63
-
64
-
65
-
66
-
67
-
68
-
69
-
70
-
71
-
72
-
73
-
74
-
75
-
76
-
77
-
78
-
79
-
80
-
81
-
82
-
83
-
84
-
85
-
86
-
87
-
88
-
89
-
90
-
91
-
92
-
93
-
94
-
95
-
96
-
97
-
98
-
99
-
100
-
101
-
102
-
103
-
104
-
105
-
106
-
107
-
108
-
109
-
110
-
111
-
112
-
113
-
114
-
115
-
116
-
117
-
118
-
119
-
120
-
121
-
122
-
123
-
124
-
125
-
126
-
127
-
128
-
129
-
130
-
131
-
132
-
133
-
134
-
135
-
136
-
137
-
138
-
139
-
140
-
141
-
142
-
143
-
144
-
145
-
146
-
147
-
148
-
149
-
150
-
151
-
152
-
153
-
154
-
155
-
156
-
157
-
158
-
159
-
160
-
161
-
162
-
163
-
164
-
165
-
166
-
167
-
168
-
169
-
170
-
171
-
172
-
173
-
174
-
175
-
176
-
177
-
178
-
179
-
180
-
181
-
182
-
183
-
184
-
185
-
186
-
187
-
188
-
189
-
190
-
191
-
192
-
193
-
194
-
195
-
196
-
197
-
198
-
199
-
200
-
201
-
202
-
203
-
204
-
205
-
206
-
207
-
208
-
209
-
210
-
211
-
212
-
213
-
214
-
215
-
216
-
217
-
218
-
219
-
220
-
221
-
222
-
223
-
224
-
225
-
226
-
227
-
228
-
229
-
230
-
231
-
232
-
233
-
234
-
235
-
236
-
237
-
238
-
239
-
240
-
241
-
242
-
243
-
244
-
245
-
246
-
247
-
248
-
249
-
250
-
251
-
252
-
253
-
254
-
255
-
256
-
257
-
258
-
259
-
260
-
261
-
262
-
263
-
264
-
265
-
266
-
267
-
268
-
269
-
270
-
271
-
272
-
273
-
274
-
275
-
276
-
277
-
278
-
279
-
280
-
281
-
282
-
283
-
284
-
285
-
286
-
287
-
288
-
289
-
290
-
291
-
292
-
293
-
294
-
295
-
296
-
297
-
298
-
299
-
300
-
301
-
302
-
303
-
304
-
305
-
306
-
307
-
308
-
309
-
310
-
311
-
312
-
313
-
314
-
315
-
316
-
317
-
318
-
319
-
320
-
321
-
322
-
323
-
324
-
325
-
326
-
327
-
328
-
329
-
330
-
331
-
332
-
333
-
334
-
335
-
336
-
337
-
338
-
339
-
340
-
341
-
342
-
343
-
344
-
345
-
346
-
347
-
348
-
349
-
350
-
351
-
352
-
353
-
354
-
355
-
356
-
357
-
358
-
359
-
360
-
361
-
362
-
363
-
364
-
365
-
366
-
367
-
368
-
369
-
370
-
371
-
372
-
373
-
374
-
375
-
376
-
377
-
378
-
379
-
380
-
381
-
382
-
383
-
384
-
385
-
386
-
387
-
388
-
389
-
390
-
391
-
392
-
393
-
394
-
395
-
396
-
397
-
398
-
399
-
400
-
401
-
402
-
403
-
404
-
405
-
406
-
407
-
408
-
409
-
410
-
411
-
412
-
413
-
414
-
415
-
416
-
417
-
418
-
419
-
420
-
421
-
422
-
423
-
424
-
425
-
426
-
427
-
428
-
429
-
430
-
431
-
432
-
433
-
434
-
435
-
436
-
437
-
438
-
439
-
440
-
441
-
442
-
443
-
444
-
445
-
446
-
447
-
448
-
449
-
450
-
451
-
452
-
453
-
454
-
455
-
456
-
457
-
458
-
459
-
460
-
461
-
462
-
463
-
464
-
465
-
466
-
467
-
468
-
469
-
470
-
471
-
472
-
473
-
474
-
475
-
476
-
477
-
478
-
479
-
480
-
481
-
482
-
483
-
484
-
485
-
486
-
487
-
488
-
489
-
490
-
491
-
492
-
493
-
494
-
495
-
496
-
497
-
498
-
499
-
500
-
501
-
502
-
503
-
504
-
505
-
506
-
507
-
508
-
509
-
510
-
511
-
512
-
513
-
514
-
515
-
516
-
517
-
518
-
519
-
520
-
521
-
522
-
523
-
524
-
525
-
526
-
527
-
528
-
529
-
530
-
531
-
532
-
533
-
534
-
535
-
536
-
537
-
538
-
539
-
540
-
541
-
542
-
543
-
544
-
545
-
546
 |
 |

HSBC HOLDINGS PLC
Report of the Directors: Operating and Financial Review (continued)
Financial summary > Group performance by income and expense item
42
following a review completed in the fourth quarter of
2012 which concluded that the estimated average
period of time from current status to write-off was
ten months for real estate loans. In CMB and
GB&M, loan impairment charges increased, mainly
in Bermuda, due to individually assessed
impairments on a small number of exposures.
In Europe, LICs decreased by 22% to
US$1.9bn. This was mainly in GB&M due to lower
credit risk provisions on available-for-sale ABSs as a
result of an improvement in underlying asset prices,
as well as lower charges on Greek sovereign debt.
Further information on our exposures to countries in
the eurozone is provided on page 192. This was
partly offset by increased impairment charges on the
legacy credit loans and receivables portfolio. In
RBWM, loan impairment charges continued to
decline, primarily in the UK, as we focused our
lending growth on higher quality assets and
continued to pro-actively identify and monitor
customers facing financial hardship. As a result,
delinquency rates improved across both the secured
and unsecured lending portfolios. This was partly
offset by an increase in impairments in Turkey due
to strong growth in previous years in our RBWM
customer loans and advances. In addition, there were
higher individually assessed provisions in CMB
across a range of sectors, reflecting increased stress
on the financial status of certain customers in the
challenging economic conditions in certain eurozone
countries.
In Hong Kong, LICs fell by 53% to US$74m,
largely due to lower specific impairment charges in
CMB and the non-recurrence of charges relating to
available-for-sale Greek sovereign debt securities.
In the Middle East and North Africa, LICs
decreased by US$6m to US$286m. Lower loan
impairment charges in RBWM reflected
repositioning of the book towards higher quality
secured lending in previous years. This was largely
offset by higher LICs recorded for a small number of
large exposures in GB&M.
LICs in Latin America and Rest of Asia-Pacific
increased compared with 2011. In Latin America,
they increased by 29% to US$2.1bn. This was
mainly in Brazil, driven by increased delinquency
rates in RBWM and CMB, particularly in the
Business Banking portfolio reflecting lower
economic growth in 2012. We took a number of
steps to reposition the portfolios in RBWM and
CMB including improving our collections
capabilities, reducing third-party originations and
lowering credit limits where appropriate. Loan
impairment charges fell in Brazil during the second
half of 2012, mainly due to lower collective portfolio
provisions.
In Rest of Asia-Pacific, LICs increased by 64%
to US$436m, notably in CMB as a result of the
impairment of a corporate exposure in Australia and
a small number of corporate exposures in India, as
well as a credit risk provision on an available-for-
sale debt security in GB&M.
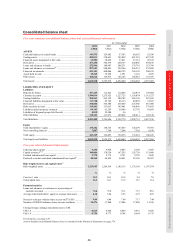
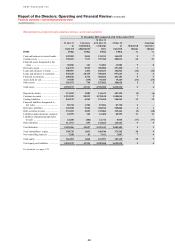
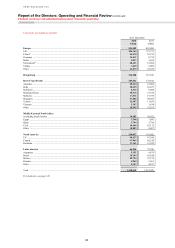
Operating expenses
2012 2011 2010
US$m US$m US$m
By expense category
Employee compensation and benefits ........................................................................ 20,491 21,166 19,836
Premises and equipment (excluding depreciation and impairment) .......................... 4,326 4,503 4,348
General and administrative expenses ......................................................................... 15,657 12,956 10,808
Administrative expenses ............................................................................................. 40,474 38,625 34,992
Depreciation and impairment of property, plant and equipment ............................... 1,484 1,570 1,713
Amortisation and impairment of intangible assets ..................................................... 969 1,350 983
Operating expenses ..................................................................................................... 42,927 41,545 37,688
Staff numbers (full-time equivalents)
At 31 December
2012 2011 2010
Europe ......................................................................................................................... 70,061 74,892 75,698
Hong Kong ................................................................................................................. 27,742 28,984 29,171
Rest of Asia-Pacific .................................................................................................... 85,024 91,051 91,607
Middle East and North Africa .................................................................................... 8,765 8,373 8,676
North America ............................................................................................................ 22,443 30,981 33,865
Latin America ............................................................................................................. 46,556 54,035 56,044
Staff numbers .............................................................................................................. 260,591 288,316 295,061