HSBC 2012 Annual Report Download - page 223
Download and view the complete annual report
Please find page 223 of the 2012 HSBC annual report below. You can navigate through the pages in the report by either clicking on the pages listed below, or by using the keyword search tool below to find specific information within the annual report.-
 1
1 -
2
-
3
-
4
-
5
-
6
-
7
-
8
-
9
-
10
-
11
-
12
-
13
-
14
-
15
-
16
-
17
-
18
-
19
-
20
-
21
-
22
-
23
-
24
-
25
-
26
-
27
-
28
-
29
-
30
-
31
-
32
-
33
-
34
-
35
-
36
-
37
-
38
-
39
-
40
-
41
-
42
-
43
-
44
-
45
-
46
-
47
-
48
-
49
-
50
-
51
-
52
-
53
-
54
-
55
-
56
-
57
-
58
-
59
-
60
-
61
-
62
-
63
-
64
-
65
-
66
-
67
-
68
-
69
-
70
-
71
-
72
-
73
-
74
-
75
-
76
-
77
-
78
-
79
-
80
-
81
-
82
-
83
-
84
-
85
-
86
-
87
-
88
-
89
-
90
-
91
-
92
-
93
-
94
-
95
-
96
-
97
-
98
-
99
-
100
-
101
-
102
-
103
-
104
-
105
-
106
-
107
-
108
-
109
-
110
-
111
-
112
-
113
-
114
-
115
-
116
-
117
-
118
-
119
-
120
-
121
-
122
-
123
-
124
-
125
-
126
-
127
-
128
-
129
-
130
-
131
-
132
-
133
-
134
-
135
-
136
-
137
-
138
-
139
-
140
-
141
-
142
-
143
-
144
-
145
-
146
-
147
-
148
-
149
-
150
-
151
-
152
-
153
-
154
-
155
-
156
-
157
-
158
-
159
-
160
-
161
-
162
-
163
-
164
-
165
-
166
-
167
-
168
-
169
-
170
-
171
-
172
-
173
-
174
-
175
-
176
-
177
-
178
-
179
-
180
-
181
-
182
-
183
-
184
-
185
-
186
-
187
-
188
-
189
-
190
-
191
-
192
-
193
-
194
-
195
-
196
-
197
-
198
-
199
-
200
-
201
-
202
-
203
-
204
-
205
-
206
-
207
-
208
-
209
-
210
-
211
-
212
-
 213
213 -
 214
214 -
 215
215 -
 216
216 -
 217
217 -
 218
218 -
 219
219 -
 220
220 -
 221
221 -
 222
222 -
 223
223 -
 224
224 -
 225
225 -
 226
226 -
 227
227 -
 228
228 -
 229
229 -
 230
230 -
 231
231 -
 232
232 -
 233
233 -
234
-
235
-
236
-
237
-
238
-
239
-
240
-
241
-
242
-
243
-
244
-
245
-
246
-
247
-
248
-
249
-
250
-
251
-
252
-
253
-
254
-
255
-
256
-
257
-
258
-
259
-
260
-
261
-
262
-
263
-
264
-
265
-
266
-
267
-
268
-
269
-
270
-
271
-
272
-
273
-
274
-
275
-
276
-
277
-
278
-
279
-
280
-
281
-
282
-
283
-
284
-
285
-
286
-
287
-
288
-
289
-
290
-
291
-
292
-
293
-
294
-
295
-
296
-
297
-
298
-
299
-
300
-
301
-
302
-
303
-
304
-
305
-
306
-
307
-
308
-
309
-
310
-
311
-
312
-
313
-
314
-
315
-
316
-
317
-
318
-
319
-
320
-
321
-
322
-
323
-
324
-
325
-
326
-
327
-
328
-
329
-
330
-
331
-
332
-
333
-
334
-
335
-
336
-
337
-
338
-
339
-
340
-
341
-
342
-
343
-
344
-
345
-
346
-
347
-
348
-
349
-
350
-
351
-
352
-
353
-
354
-
355
-
356
-
357
-
358
-
359
-
360
-
361
-
362
-
363
-
364
-
365
-
366
-
367
-
368
-
369
-
370
-
371
-
372
-
373
-
374
-
375
-
376
-
377
-
378
-
379
-
380
-
381
-
382
-
383
-
384
-
385
-
386
-
387
-
388
-
389
-
390
-
391
-
392
-
393
-
394
-
395
-
396
-
397
-
398
-
399
-
400
-
401
-
402
-
403
-
404
-
405
-
406
-
407
-
408
-
409
-
410
-
411
-
412
-
413
-
414
-
415
-
416
-
417
-
418
-
419
-
420
-
421
-
422
-
423
-
424
-
425
-
426
-
427
-
428
-
429
-
430
-
431
-
432
-
433
-
434
-
435
-
436
-
437
-
438
-
439
-
440
-
441
-
442
-
443
-
444
-
445
-
446
-
447
-
448
-
449
-
450
-
451
-
452
-
453
-
454
-
455
-
456
-
457
-
458
-
459
-
460
-
461
-
462
-
463
-
464
-
465
-
466
-
467
-
468
-
469
-
470
-
471
-
472
-
473
-
474
-
475
-
476
-
477
-
478
-
479
-
480
-
481
-
482
-
483
-
484
-
485
-
486
-
487
-
488
-
489
-
490
-
491
-
492
-
493
-
494
-
495
-
496
-
497
-
498
-
499
-
500
-
501
-
502
-
503
-
504
-
505
-
506
-
507
-
508
-
509
-
510
-
511
-
512
-
513
-
514
-
515
-
516
-
517
-
518
-
519
-
520
-
521
-
522
-
523
-
524
-
525
-
526
-
527
-
528
-
529
-
530
-
531
-
532
-
533
-
534
-
535
-
536
-
537
-
538
-
539
-
540
-
541
-
542
-
543
-
544
-
545
-
546
 |
 |
221
Overview Operating & Financial Review Corporate Governance Financial Statements Shareholder Information
Foreign
exchange and
commodity
Interest
rate
Equity
Credit
spread
Portfolio
diversification51 Total52
US$m US$m US$m US$m US$m US$m
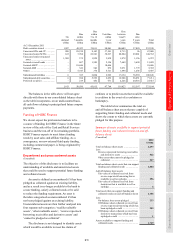
At 31 December 2011 ....... 18.6 49.4 7.4 75.2 (32.3) 118.3
Average ............................. 16.8 54.2 8.0 57.3 (34.4) 101.8
Minimum .......................... 7.6 30.1 2.5 34.7 – 62.2
Maximum .......................... 31.9 80.2 17.2 103.2 – 143.9
For footnotes, see page 249.
Stressed value at risk of the trading
portfolios
(Unaudited)
Stressed VAR is primarily used for regulatory capital
purposes but is integrated into the risk management
process to facilitate efficient capital management and
to highlight potentially risky positions based on
previous market volatility.
Our Group stressed VAR for trading portfolios
was as follows:
Stressed value at risk (1-day equivalent)
(Unaudited)
2012 2011
US$m US$m
At 31 December ....................... 172.4 293.6
Stressed VAR for trading portfolios reduced
primarily as a result of the de-risking of exposures to
eurozone sovereigns and managing down of interest
rate risks, together with the impact of lower credit
spread levels on the VAR calculation.
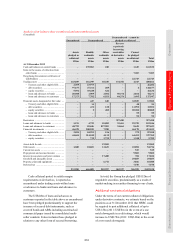
Non-trading portfolios
(Audited)
Value at risk of the non-trading portfolios
Non-trading value at risk
2012 2011
US$m US$m
At 31 December ....................... 119.2 310.9
Average .................................... 197.9 244.2
Minimum ................................. 118.1 182.2
Maximum ................................. 322.5 354.8
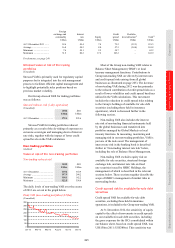
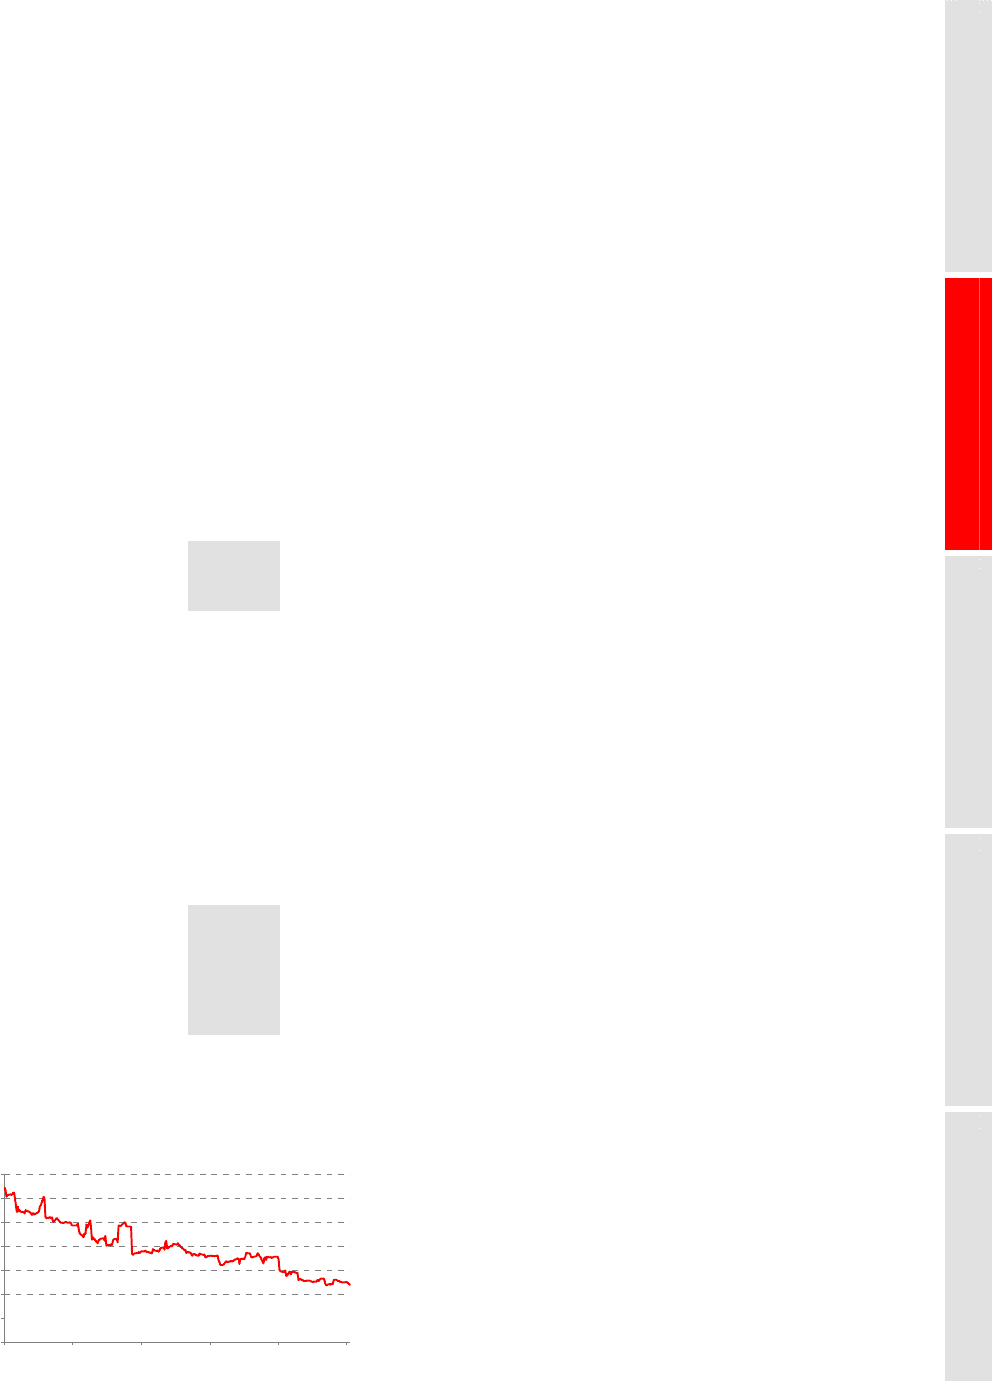
The daily levels of non-trading VAR over the course
of 2012 are set out in the graph below.
Daily VAR (non-trading portfolios) (US$m)
(Unaudited)
0
50
100
150
200
250
300
350
Jan-12 Mar-12 May-12 Aug-12 Oct-12 Dec-12
Most of the Group non-trading VAR relates to
Balance Sheet Management (‘BSM’) or local
treasury management functions. Contributions to
Group non-trading VAR are driven by interest rates
and credit spread risks arising from all global
businesses as illustrated on page 265). The decrease
of non-trading VAR during 2012 was due primarily
to the reduced contribution of credit spread risks as a
result of lower volatilities and credit spread baselines
utilised in the VAR calculations. This movement
includes the reduction in credit spread risks relating
to the Group’s holdings of available for sale debt
securities (excluding those held in insurance
operations), which is discussed further in the
following section.
Non-trading VAR also includes the interest
rate risk of non-trading financial instruments held
by the global businesses and transferred into
portfolios managed by Global Markets or local
treasury functions. In measuring, monitoring and
managing risk in our non-trading portfolios, VAR is
just one of the tools used. The management of
interest rate risk in the banking book is described
further in ‘Non-trading interest rate risk’ below,
including the role of Balance Sheet Management.
Non-trading VAR excludes equity risk on
available for sale securities, structural foreign
exchange risk, and interest rate risk on fixed
rate securities issued by HSBC Holdings, the
management of which is described in the relevant
sections below. These sections together describe the
scope of HSBC’s management of market risks in
non-trading books.
Credit spread risk for available-for-sale debt
securities
Credit spread VAR for available-for-sale debt
securities, excluding those held in insurance
operations, is included in the Group non-trading VAR.
At 31 December 2012, the sensitivity of equity
capital to the effect of movements in credit spreads
on our available-for-sale debt securities, including
the gross exposure for the SICs consolidated within
our balance sheet, based on credit spread VAR, was
US$150m (2011: US$389m). This sensitivity was