HSBC 2012 Annual Report Download - page 241
Download and view the complete annual report
Please find page 241 of the 2012 HSBC annual report below. You can navigate through the pages in the report by either clicking on the pages listed below, or by using the keyword search tool below to find specific information within the annual report.-
 1
1 -
2
-
3
-
4
-
5
-
6
-
7
-
8
-
9
-
10
-
11
-
12
-
13
-
14
-
15
-
16
-
17
-
18
-
19
-
20
-
21
-
22
-
23
-
24
-
25
-
26
-
27
-
28
-
29
-
30
-
31
-
32
-
33
-
34
-
35
-
36
-
37
-
38
-
39
-
40
-
41
-
42
-
43
-
44
-
45
-
46
-
47
-
48
-
49
-
50
-
51
-
52
-
53
-
54
-
55
-
56
-
57
-
58
-
59
-
60
-
61
-
62
-
63
-
64
-
65
-
66
-
67
-
68
-
69
-
70
-
71
-
72
-
73
-
74
-
75
-
76
-
77
-
78
-
79
-
80
-
81
-
82
-
83
-
84
-
85
-
86
-
87
-
88
-
89
-
90
-
91
-
92
-
93
-
94
-
95
-
96
-
97
-
98
-
99
-
100
-
101
-
102
-
103
-
104
-
105
-
106
-
107
-
108
-
109
-
110
-
111
-
112
-
113
-
114
-
115
-
116
-
117
-
118
-
119
-
120
-
121
-
122
-
123
-
124
-
125
-
126
-
127
-
128
-
129
-
130
-
131
-
132
-
133
-
134
-
135
-
136
-
137
-
138
-
139
-
140
-
141
-
142
-
143
-
144
-
145
-
146
-
147
-
148
-
149
-
150
-
151
-
152
-
153
-
154
-
155
-
156
-
157
-
158
-
159
-
160
-
161
-
162
-
163
-
164
-
165
-
166
-
167
-
168
-
169
-
170
-
171
-
172
-
173
-
174
-
175
-
176
-
177
-
178
-
179
-
180
-
181
-
182
-
183
-
184
-
185
-
186
-
187
-
188
-
189
-
190
-
191
-
192
-
193
-
194
-
195
-
196
-
197
-
198
-
199
-
200
-
201
-
202
-
203
-
204
-
205
-
206
-
207
-
208
-
209
-
210
-
211
-
212
-
213
-
214
-
215
-
216
-
217
-
218
-
219
-
220
-
221
-
222
-
223
-
224
-
225
-
226
-
227
-
228
-
229
-
230
-
 231
231 -
 232
232 -
 233
233 -
 234
234 -
 235
235 -
 236
236 -
 237
237 -
 238
238 -
 239
239 -
 240
240 -
 241
241 -
 242
242 -
 243
243 -
 244
244 -
 245
245 -
 246
246 -
 247
247 -
 248
248 -
 249
249 -
 250
250 -
 251
251 -
252
-
253
-
254
-
255
-
256
-
257
-
258
-
259
-
260
-
261
-
262
-
263
-
264
-
265
-
266
-
267
-
268
-
269
-
270
-
271
-
272
-
273
-
274
-
275
-
276
-
277
-
278
-
279
-
280
-
281
-
282
-
283
-
284
-
285
-
286
-
287
-
288
-
289
-
290
-
291
-
292
-
293
-
294
-
295
-
296
-
297
-
298
-
299
-
300
-
301
-
302
-
303
-
304
-
305
-
306
-
307
-
308
-
309
-
310
-
311
-
312
-
313
-
314
-
315
-
316
-
317
-
318
-
319
-
320
-
321
-
322
-
323
-
324
-
325
-
326
-
327
-
328
-
329
-
330
-
331
-
332
-
333
-
334
-
335
-
336
-
337
-
338
-
339
-
340
-
341
-
342
-
343
-
344
-
345
-
346
-
347
-
348
-
349
-
350
-
351
-
352
-
353
-
354
-
355
-
356
-
357
-
358
-
359
-
360
-
361
-
362
-
363
-
364
-
365
-
366
-
367
-
368
-
369
-
370
-
371
-
372
-
373
-
374
-
375
-
376
-
377
-
378
-
379
-
380
-
381
-
382
-
383
-
384
-
385
-
386
-
387
-
388
-
389
-
390
-
391
-
392
-
393
-
394
-
395
-
396
-
397
-
398
-
399
-
400
-
401
-
402
-
403
-
404
-
405
-
406
-
407
-
408
-
409
-
410
-
411
-
412
-
413
-
414
-
415
-
416
-
417
-
418
-
419
-
420
-
421
-
422
-
423
-
424
-
425
-
426
-
427
-
428
-
429
-
430
-
431
-
432
-
433
-
434
-
435
-
436
-
437
-
438
-
439
-
440
-
441
-
442
-
443
-
444
-
445
-
446
-
447
-
448
-
449
-
450
-
451
-
452
-
453
-
454
-
455
-
456
-
457
-
458
-
459
-
460
-
461
-
462
-
463
-
464
-
465
-
466
-
467
-
468
-
469
-
470
-
471
-
472
-
473
-
474
-
475
-
476
-
477
-
478
-
479
-
480
-
481
-
482
-
483
-
484
-
485
-
486
-
487
-
488
-
489
-
490
-
491
-
492
-
493
-
494
-
495
-
496
-
497
-
498
-
499
-
500
-
501
-
502
-
503
-
504
-
505
-
506
-
507
-
508
-
509
-
510
-
511
-
512
-
513
-
514
-
515
-
516
-
517
-
518
-
519
-
520
-
521
-
522
-
523
-
524
-
525
-
526
-
527
-
528
-
529
-
530
-
531
-
532
-
533
-
534
-
535
-
536
-
537
-
538
-
539
-
540
-
541
-
542
-
543
-
544
-
545
-
546
 |
 |

239
Overview Operating & Financial Review Corporate Governance Financial Statements Shareholder Information
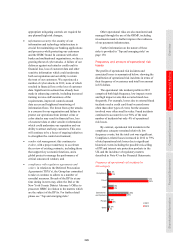
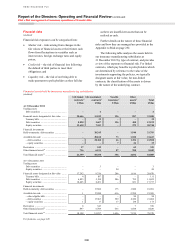
Approximately 65.6% of financial assets were
invested in debt securities at 31 December 2012
(2011: 65.2%) with 24.5% (2011: 22.9%) invested
in equity securities.
In life linked insurance, premium income less
charges levied is invested in a portfolio of assets. We
manage the financial risks of this product on behalf
of the policyholders by holding appropriate assets in
segregated funds or portfolios to which the liabilities
are linked. These assets represented 25.2% (2011:
23.2%) of the total financial assets of our insurance
manufacturing subsidiaries at the end of 2012.
The remaining financial risks are managed
either solely on behalf of the shareholder, or jointly
on behalf of the shareholder and policyholders where
DPF exist.
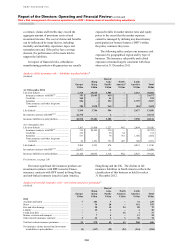
Market risk
(Audited)
Market risk arises when mismatches occur between
product liabilities and the investment assets which
back them. For example, mismatches between asset
and liability yields and maturities give rise to interest
rate risk.
Long-term insurance or investment products
may incorporate benefits that are guaranteed. Where
mismatches exist as a result of current yields falling
below guaranteed levels for a prolonged period, the
risk that shareholder capital is required to meet
liabilities to policyholders increases. The table below
shows, in respect of each category of guarantee, the
total liabilities to policyholders established for
guaranteed products manufactured by our insurance
subsidiaries. The table also shows the range of
investment returns on the assets supporting these
products and the implied investment returns that
would enable the business to meet the guarantees.
Immediate annuities, where current investment
returns are below guarantees, relate to a closed
portfolio in the US which is held for sale at
31 December 2012. Annual return guarantees
between 4.5-6%, where current investment returns
are below guarantees, is a closed portfolio in Hong
Kong. The only other portfolio of contracts
identified where current investment returns are
below guarantees relate to a closed portfolio in
France. This portfolio has reserves of US$495m for
which current portfolio yields are 3.25% but
investment returns implied by the guarantees are
4.5%.
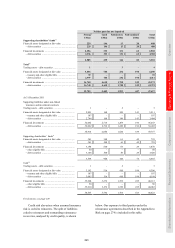
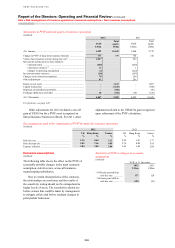
Liabilities to policyholders69
(Audited)
2012 2011
Amount of
reserve
Investment
returns
implied by
guarantee64
Current
yields
Amount of
reserve
Investment
returns
implied by
guarantee64
Current
yields
US$m % % US$m % %
Annuities in payment .......................................... 1,379 0.0 – 11.7 4.6 – 20.8 1,414 0.0 – 9.6 4.2 – 25.2
Deferred annuities .............................................. 179 0.0 – 6.0 3.3 – 20.4 175 0.0 – 6.0 3.2 – 22.7
Immediate annuities70 ......................................... 485 6.0 – 12.0 5.4 – 5.5 538 6.0 – 12.0 5.3 – 5.4
Annual return ...................................................... 23,878 0.0 – 2.5 1.4 – 4.7 20,465 0.0 – 2.5 0.0 – 6.9
Annual return ...................................................... 4,315 2.5 – 4.5 3.3 – 6.7 3,849 2.5 – 4.5 3.3 – 10.0
Annual return ...................................................... 155 4.5 – 6.0 4.1 – 4.2 163 4.5 – 6.0 6.4 – 6.5
Capital ................................................................. 18,779 – 0.0 – 7.2 17,400 – 2.3 – 7.8
For footnotes, see page 249.
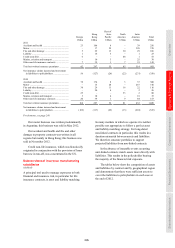
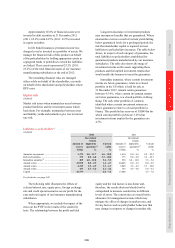
The following table illustrates the effects of
selected interest rate, equity price, foreign exchange
rate and credit spread scenarios on our profit for the
year and total equity of our insurance manufacturing
subsidiaries.
Where appropriate, we include the impact of the
stress on the PVIF in the results of the sensitivity
tests. The relationship between the profit and total
equity and the risk factors is non-linear and,
therefore, the results disclosed should not be
extrapolated to measure sensitivities to different
levels of stress. The sensitivities are stated before
allowance for management actions which may
mitigate the effect of changes in market rates, and
for any factors such as policyholder behaviour that
may change in response to changes in market risk.