HSBC 2012 Annual Report Download - page 287
Download and view the complete annual report
Please find page 287 of the 2012 HSBC annual report below. You can navigate through the pages in the report by either clicking on the pages listed below, or by using the keyword search tool below to find specific information within the annual report.-
 1
1 -
2
-
3
-
4
-
5
-
6
-
7
-
8
-
9
-
10
-
11
-
12
-
13
-
14
-
15
-
16
-
17
-
18
-
19
-
20
-
21
-
22
-
23
-
24
-
25
-
26
-
27
-
28
-
29
-
30
-
31
-
32
-
33
-
34
-
35
-
36
-
37
-
38
-
39
-
40
-
41
-
42
-
43
-
44
-
45
-
46
-
47
-
48
-
49
-
50
-
51
-
52
-
53
-
54
-
55
-
56
-
57
-
58
-
59
-
60
-
61
-
62
-
63
-
64
-
65
-
66
-
67
-
68
-
69
-
70
-
71
-
72
-
73
-
74
-
75
-
76
-
77
-
78
-
79
-
80
-
81
-
82
-
83
-
84
-
85
-
86
-
87
-
88
-
89
-
90
-
91
-
92
-
93
-
94
-
95
-
96
-
97
-
98
-
99
-
100
-
101
-
102
-
103
-
104
-
105
-
106
-
107
-
108
-
109
-
110
-
111
-
112
-
113
-
114
-
115
-
116
-
117
-
118
-
119
-
120
-
121
-
122
-
123
-
124
-
125
-
126
-
127
-
128
-
129
-
130
-
131
-
132
-
133
-
134
-
135
-
136
-
137
-
138
-
139
-
140
-
141
-
142
-
143
-
144
-
145
-
146
-
147
-
148
-
149
-
150
-
151
-
152
-
153
-
154
-
155
-
156
-
157
-
158
-
159
-
160
-
161
-
162
-
163
-
164
-
165
-
166
-
167
-
168
-
169
-
170
-
171
-
172
-
173
-
174
-
175
-
176
-
177
-
178
-
179
-
180
-
181
-
182
-
183
-
184
-
185
-
186
-
187
-
188
-
189
-
190
-
191
-
192
-
193
-
194
-
195
-
196
-
197
-
198
-
199
-
200
-
201
-
202
-
203
-
204
-
205
-
206
-
207
-
208
-
209
-
210
-
211
-
212
-
213
-
214
-
215
-
216
-
217
-
218
-
219
-
220
-
221
-
222
-
223
-
224
-
225
-
226
-
227
-
228
-
229
-
230
-
231
-
232
-
233
-
234
-
235
-
236
-
237
-
238
-
239
-
240
-
241
-
242
-
243
-
244
-
245
-
246
-
247
-
248
-
249
-
250
-
251
-
252
-
253
-
254
-
255
-
256
-
257
-
258
-
259
-
260
-
261
-
262
-
263
-
264
-
265
-
266
-
267
-
268
-
269
-
270
-
271
-
272
-
273
-
274
-
275
-
276
-
 277
277 -
 278
278 -
 279
279 -
 280
280 -
 281
281 -
 282
282 -
 283
283 -
 284
284 -
 285
285 -
 286
286 -
 287
287 -
 288
288 -
 289
289 -
 290
290 -
 291
291 -
 292
292 -
 293
293 -
 294
294 -
 295
295 -
 296
296 -
 297
297 -
298
-
299
-
300
-
301
-
302
-
303
-
304
-
305
-
306
-
307
-
308
-
309
-
310
-
311
-
312
-
313
-
314
-
315
-
316
-
317
-
318
-
319
-
320
-
321
-
322
-
323
-
324
-
325
-
326
-
327
-
328
-
329
-
330
-
331
-
332
-
333
-
334
-
335
-
336
-
337
-
338
-
339
-
340
-
341
-
342
-
343
-
344
-
345
-
346
-
347
-
348
-
349
-
350
-
351
-
352
-
353
-
354
-
355
-
356
-
357
-
358
-
359
-
360
-
361
-
362
-
363
-
364
-
365
-
366
-
367
-
368
-
369
-
370
-
371
-
372
-
373
-
374
-
375
-
376
-
377
-
378
-
379
-
380
-
381
-
382
-
383
-
384
-
385
-
386
-
387
-
388
-
389
-
390
-
391
-
392
-
393
-
394
-
395
-
396
-
397
-
398
-
399
-
400
-
401
-
402
-
403
-
404
-
405
-
406
-
407
-
408
-
409
-
410
-
411
-
412
-
413
-
414
-
415
-
416
-
417
-
418
-
419
-
420
-
421
-
422
-
423
-
424
-
425
-
426
-
427
-
428
-
429
-
430
-
431
-
432
-
433
-
434
-
435
-
436
-
437
-
438
-
439
-
440
-
441
-
442
-
443
-
444
-
445
-
446
-
447
-
448
-
449
-
450
-
451
-
452
-
453
-
454
-
455
-
456
-
457
-
458
-
459
-
460
-
461
-
462
-
463
-
464
-
465
-
466
-
467
-
468
-
469
-
470
-
471
-
472
-
473
-
474
-
475
-
476
-
477
-
478
-
479
-
480
-
481
-
482
-
483
-
484
-
485
-
486
-
487
-
488
-
489
-
490
-
491
-
492
-
493
-
494
-
495
-
496
-
497
-
498
-
499
-
500
-
501
-
502
-
503
-
504
-
505
-
506
-
507
-
508
-
509
-
510
-
511
-
512
-
513
-
514
-
515
-
516
-
517
-
518
-
519
-
520
-
521
-
522
-
523
-
524
-
525
-
526
-
527
-
528
-
529
-
530
-
531
-
532
-
533
-
534
-
535
-
536
-
537
-
538
-
539
-
540
-
541
-
542
-
543
-
544
-
545
-
546
 |
 |

285
Overview Operating & Financial Review Corporate Governance Financial Statements Shareholder Information
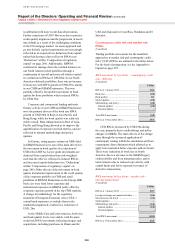
Market risk RWAs decreased by US$10bn
in 2012 with the main driver being a reduction in
risk levels of US$11bn in GB&M, primarily as
a result of decreasing VAR due to reductions in
exposure and improvements in market conditions.
The factors affecting the reductions in VAR also
drove the reductions in the levels of stressed VAR.
The effect was partly offset by a US$4.0bn risk level
increase in the incremental risk charge as a result of
a recalibration of the sovereign correlation matrix.
RWA changes due to methodology and policy of
US$2.4bn were due to a reduction in the VAR
multiplier in France.
Market risk RWA movements for portfolios
not within scope of modelled approaches showed a
reduction of US$8.0bn. This was mainly driven by
management actions by GB&M to reduce legacy
positions in North America.
Operational risk RWAs
(Unaudited)
Operational risk RWAs remained stable in 2012,
being calculated on a three-year average of revenues.
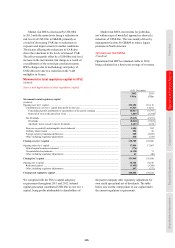
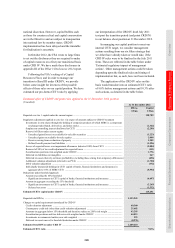
Movement in total regulatory capital in 2012
(Audited)
Source and application of total regulatory capital
At 31 December
2012
US$m
2011
US$m
Movement in total regulatory capital
(Audited)
Opening core tier 1 capital ....................................................................................................................... 122,496 116,116
Contribution to core tier 1 capital from profit for the year .................................................................. 17,827 14,011
Consolidated profits attributable to shareholders of the parent company ....................................... 14,027 16,797
Removal of own credit spread net of tax ......................................................................................... 3,800 (2,786)
Net dividends ........................................................................................................................................ (5,613) (5,271)
Dividends ......................................................................................................................................... (8,042) (7,501)
Add back: shares issued in lieu of dividends ................................................................................... 2,429 2,230
Decrease in goodwill and intangible assets deducted .......................................................................... 1,686 582
Ordinary shares issued ......................................................................................................................... 594 96
Foreign currency translation differences ............................................................................................. 989 (2,705)
Other, including regulatory adjustments .............................................................................................. 810 (333)
Closing core tier 1 capital ...................................................................................................................... 138,789 122,496
Opening other tier 1 capital ...................................................................................................................... 17,094 17,063
Hybrid capital securities redeemed ...................................................................................................... (776) –
Unconsolidated investments ................................................................................................................. (4,120) 71
Other, including regulatory adjustments .............................................................................................. 61 (40)
Closing tier 1 capital ............................................................................................................................... 151,048 139,590
Opening tier 2 capital ............................................................................................................................... 30,744 34,376
Redeemed capital ................................................................................................................................. (1,483) (3,360)
Other, including regulatory adjustments .............................................................................................. 497 (272)
Closing total regulatory capital ............................................................................................................. 180,806 170,334
We complied with the FSA’s capital adequacy
requirements throughout 2011 and 2012. Internal
capital generation contributed US$12bn to core tier 1
capital, being profits attributable to shareholders of
the parent company after regulatory adjustment for
own credit spread and net of dividends. The table
below sets out the composition of our capital under
the current regulatory requirements.