HSBC 2012 Annual Report Download - page 195
Download and view the complete annual report
Please find page 195 of the 2012 HSBC annual report below. You can navigate through the pages in the report by either clicking on the pages listed below, or by using the keyword search tool below to find specific information within the annual report.-
 1
1 -
2
-
3
-
4
-
5
-
6
-
7
-
8
-
9
-
10
-
11
-
12
-
13
-
14
-
15
-
16
-
17
-
18
-
19
-
20
-
21
-
22
-
23
-
24
-
25
-
26
-
27
-
28
-
29
-
30
-
31
-
32
-
33
-
34
-
35
-
36
-
37
-
38
-
39
-
40
-
41
-
42
-
43
-
44
-
45
-
46
-
47
-
48
-
49
-
50
-
51
-
52
-
53
-
54
-
55
-
56
-
57
-
58
-
59
-
60
-
61
-
62
-
63
-
64
-
65
-
66
-
67
-
68
-
69
-
70
-
71
-
72
-
73
-
74
-
75
-
76
-
77
-
78
-
79
-
80
-
81
-
82
-
83
-
84
-
85
-
86
-
87
-
88
-
89
-
90
-
91
-
92
-
93
-
94
-
95
-
96
-
97
-
98
-
99
-
100
-
101
-
102
-
103
-
104
-
105
-
106
-
107
-
108
-
109
-
110
-
111
-
112
-
113
-
114
-
115
-
116
-
117
-
118
-
119
-
120
-
121
-
122
-
123
-
124
-
125
-
126
-
127
-
128
-
129
-
130
-
131
-
132
-
133
-
134
-
135
-
136
-
137
-
138
-
139
-
140
-
141
-
142
-
143
-
144
-
145
-
146
-
147
-
148
-
149
-
150
-
151
-
152
-
153
-
154
-
155
-
156
-
157
-
158
-
159
-
160
-
161
-
162
-
163
-
164
-
165
-
166
-
167
-
168
-
169
-
170
-
171
-
172
-
173
-
174
-
175
-
176
-
177
-
178
-
179
-
180
-
181
-
182
-
183
-
184
-
 185
185 -
 186
186 -
 187
187 -
 188
188 -
 189
189 -
 190
190 -
 191
191 -
 192
192 -
 193
193 -
 194
194 -
 195
195 -
 196
196 -
 197
197 -
 198
198 -
 199
199 -
 200
200 -
 201
201 -
 202
202 -
 203
203 -
 204
204 -
 205
205 -
206
-
207
-
208
-
209
-
210
-
211
-
212
-
213
-
214
-
215
-
216
-
217
-
218
-
219
-
220
-
221
-
222
-
223
-
224
-
225
-
226
-
227
-
228
-
229
-
230
-
231
-
232
-
233
-
234
-
235
-
236
-
237
-
238
-
239
-
240
-
241
-
242
-
243
-
244
-
245
-
246
-
247
-
248
-
249
-
250
-
251
-
252
-
253
-
254
-
255
-
256
-
257
-
258
-
259
-
260
-
261
-
262
-
263
-
264
-
265
-
266
-
267
-
268
-
269
-
270
-
271
-
272
-
273
-
274
-
275
-
276
-
277
-
278
-
279
-
280
-
281
-
282
-
283
-
284
-
285
-
286
-
287
-
288
-
289
-
290
-
291
-
292
-
293
-
294
-
295
-
296
-
297
-
298
-
299
-
300
-
301
-
302
-
303
-
304
-
305
-
306
-
307
-
308
-
309
-
310
-
311
-
312
-
313
-
314
-
315
-
316
-
317
-
318
-
319
-
320
-
321
-
322
-
323
-
324
-
325
-
326
-
327
-
328
-
329
-
330
-
331
-
332
-
333
-
334
-
335
-
336
-
337
-
338
-
339
-
340
-
341
-
342
-
343
-
344
-
345
-
346
-
347
-
348
-
349
-
350
-
351
-
352
-
353
-
354
-
355
-
356
-
357
-
358
-
359
-
360
-
361
-
362
-
363
-
364
-
365
-
366
-
367
-
368
-
369
-
370
-
371
-
372
-
373
-
374
-
375
-
376
-
377
-
378
-
379
-
380
-
381
-
382
-
383
-
384
-
385
-
386
-
387
-
388
-
389
-
390
-
391
-
392
-
393
-
394
-
395
-
396
-
397
-
398
-
399
-
400
-
401
-
402
-
403
-
404
-
405
-
406
-
407
-
408
-
409
-
410
-
411
-
412
-
413
-
414
-
415
-
416
-
417
-
418
-
419
-
420
-
421
-
422
-
423
-
424
-
425
-
426
-
427
-
428
-
429
-
430
-
431
-
432
-
433
-
434
-
435
-
436
-
437
-
438
-
439
-
440
-
441
-
442
-
443
-
444
-
445
-
446
-
447
-
448
-
449
-
450
-
451
-
452
-
453
-
454
-
455
-
456
-
457
-
458
-
459
-
460
-
461
-
462
-
463
-
464
-
465
-
466
-
467
-
468
-
469
-
470
-
471
-
472
-
473
-
474
-
475
-
476
-
477
-
478
-
479
-
480
-
481
-
482
-
483
-
484
-
485
-
486
-
487
-
488
-
489
-
490
-
491
-
492
-
493
-
494
-
495
-
496
-
497
-
498
-
499
-
500
-
501
-
502
-
503
-
504
-
505
-
506
-
507
-
508
-
509
-
510
-
511
-
512
-
513
-
514
-
515
-
516
-
517
-
518
-
519
-
520
-
521
-
522
-
523
-
524
-
525
-
526
-
527
-
528
-
529
-
530
-
531
-
532
-
533
-
534
-
535
-
536
-
537
-
538
-
539
-
540
-
541
-
542
-
543
-
544
-
545
-
546
 |
 |

193
Overview Operating & Financial Review Corporate Governance Financial Statements Shareholder Information
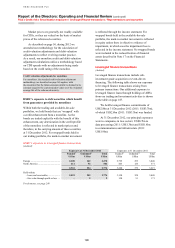
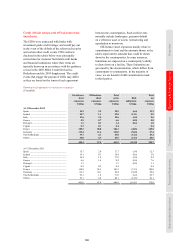
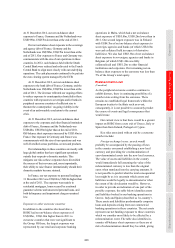
Credit default swaps and off-balance sheet
exposures
The CDSs were transacted with banks with
investment grade credit ratings, and would pay out
in the event of the default of the referenced security
and certain other credit events. CDS contracts
disclosed in the tables below were principally
entered into for customer facilitation with banks
and financial institutions where their terms are
typically drawn up in accordance with the guidance
set out in the 2003 ISDA Credit Derivatives
Definitions and the 2009 Supplement. The credit
events that trigger the payout of CDSs may differ
as they are based on the terms of each agreement
between the counterparties. Such credit events
normally include bankruptcy, payment default
on a reference asset or assets, restructuring and
repudiation or moratoria.
Off-balance sheet exposures mainly relate to
commitments to lend and the amounts shown in the
tables represent the amounts that could be drawn
down by the counterparties. In some instances,
limitations are imposed on a counterparty’s ability
to draw down on a facility. These limitations are
governed by the documentation, which differs from
counterparty to counterparty. In the majority of
cases, we are bound to fulfil commitments made
to third parties.
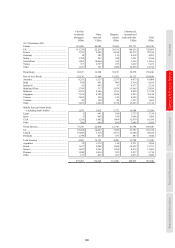
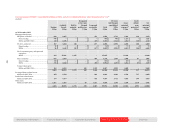
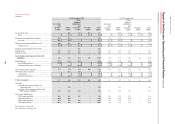
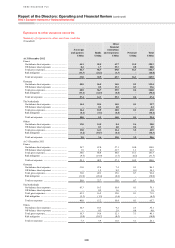
Summary of exposures to eurozone countries
(Unaudited)
On-balance
sheet
exposures
Off-balance
sheet
exposures
Total
gross
exposures
Risk
mitigation
Total
net
exposure
US$bn US$bn US$bn US$bn US$bn
At 31 December 2012
Spain ............................................................... 15.3 3.2 18.5 (6.4) 12.1
Ireland ............................................................. 20.7 1.3 22.0 (12.1) 9.9
Italy ................................................................. 12.6 3.0 15.6 (6.0) 9.6
Greece ............................................................. 5.9 0.7 6.6 (0.8) 5.8
Portugal ........................................................... 1.1 0.3 1.4 (0.4) 1.0
Cyprus ............................................................. 0.3 0.1 0.4 – 0.4
France ............................................................. 158.3 28.0 186.3 (40.8) 145.5
Germany ......................................................... 112.4 11.6 124.0 (56.6) 67.4
The Netherlands .............................................. 39.7 4.1 43.8 (14.4) 29.4
Others .............................................................. 38.0 4.9 42.9 (14.3) 28.6
404.3 57.2 461.5 (151.8) 309.7
At 31 December 2011
Spain ............................................................... 15.7 2.0 17.7 (5.4) 12.3
Ireland ............................................................. 14.1 0.3 14.4 (8.6) 5.8
Italy ................................................................. 16.4 1.4 17.8 (9.4) 8.4
Greece ............................................................. 6.6 1.6 8.2 (0.6) 7.6
Portugal ........................................................... 1.7 – 1.7 (0.6) 1.1
Cyprus.............................................................. 0.2 0.2 0.4 – 0.4
France ............................................................. 154.8 26.5 181.3 (31.3) 150.0
Germany ......................................................... 86.3 10.1 96.4 (38.0) 58.4
The Netherlands .............................................. 70.1 1.8 71.9 (6.2) 65.7
Others .............................................................. 36.1 4.0 40.1 (14.0) 26.1
402.0 47.9 449.9 (114.1) 335.8