HSBC 2012 Annual Report Download - page 45
Download and view the complete annual report
Please find page 45 of the 2012 HSBC annual report below. You can navigate through the pages in the report by either clicking on the pages listed below, or by using the keyword search tool below to find specific information within the annual report.-
 1
1 -
2
-
3
-
4
-
5
-
6
-
7
-
8
-
9
-
10
-
11
-
12
-
13
-
14
-
15
-
16
-
17
-
18
-
19
-
20
-
21
-
22
-
23
-
24
-
25
-
26
-
27
-
28
-
29
-
30
-
31
-
32
-
33
-
34
-
 35
35 -
 36
36 -
 37
37 -
 38
38 -
 39
39 -
 40
40 -
 41
41 -
 42
42 -
 43
43 -
 44
44 -
 45
45 -
 46
46 -
 47
47 -
 48
48 -
 49
49 -
 50
50 -
 51
51 -
 52
52 -
 53
53 -
 54
54 -
 55
55 -
56
-
57
-
58
-
59
-
60
-
61
-
62
-
63
-
64
-
65
-
66
-
67
-
68
-
69
-
70
-
71
-
72
-
73
-
74
-
75
-
76
-
77
-
78
-
79
-
80
-
81
-
82
-
83
-
84
-
85
-
86
-
87
-
88
-
89
-
90
-
91
-
92
-
93
-
94
-
95
-
96
-
97
-
98
-
99
-
100
-
101
-
102
-
103
-
104
-
105
-
106
-
107
-
108
-
109
-
110
-
111
-
112
-
113
-
114
-
115
-
116
-
117
-
118
-
119
-
120
-
121
-
122
-
123
-
124
-
125
-
126
-
127
-
128
-
129
-
130
-
131
-
132
-
133
-
134
-
135
-
136
-
137
-
138
-
139
-
140
-
141
-
142
-
143
-
144
-
145
-
146
-
147
-
148
-
149
-
150
-
151
-
152
-
153
-
154
-
155
-
156
-
157
-
158
-
159
-
160
-
161
-
162
-
163
-
164
-
165
-
166
-
167
-
168
-
169
-
170
-
171
-
172
-
173
-
174
-
175
-
176
-
177
-
178
-
179
-
180
-
181
-
182
-
183
-
184
-
185
-
186
-
187
-
188
-
189
-
190
-
191
-
192
-
193
-
194
-
195
-
196
-
197
-
198
-
199
-
200
-
201
-
202
-
203
-
204
-
205
-
206
-
207
-
208
-
209
-
210
-
211
-
212
-
213
-
214
-
215
-
216
-
217
-
218
-
219
-
220
-
221
-
222
-
223
-
224
-
225
-
226
-
227
-
228
-
229
-
230
-
231
-
232
-
233
-
234
-
235
-
236
-
237
-
238
-
239
-
240
-
241
-
242
-
243
-
244
-
245
-
246
-
247
-
248
-
249
-
250
-
251
-
252
-
253
-
254
-
255
-
256
-
257
-
258
-
259
-
260
-
261
-
262
-
263
-
264
-
265
-
266
-
267
-
268
-
269
-
270
-
271
-
272
-
273
-
274
-
275
-
276
-
277
-
278
-
279
-
280
-
281
-
282
-
283
-
284
-
285
-
286
-
287
-
288
-
289
-
290
-
291
-
292
-
293
-
294
-
295
-
296
-
297
-
298
-
299
-
300
-
301
-
302
-
303
-
304
-
305
-
306
-
307
-
308
-
309
-
310
-
311
-
312
-
313
-
314
-
315
-
316
-
317
-
318
-
319
-
320
-
321
-
322
-
323
-
324
-
325
-
326
-
327
-
328
-
329
-
330
-
331
-
332
-
333
-
334
-
335
-
336
-
337
-
338
-
339
-
340
-
341
-
342
-
343
-
344
-
345
-
346
-
347
-
348
-
349
-
350
-
351
-
352
-
353
-
354
-
355
-
356
-
357
-
358
-
359
-
360
-
361
-
362
-
363
-
364
-
365
-
366
-
367
-
368
-
369
-
370
-
371
-
372
-
373
-
374
-
375
-
376
-
377
-
378
-
379
-
380
-
381
-
382
-
383
-
384
-
385
-
386
-
387
-
388
-
389
-
390
-
391
-
392
-
393
-
394
-
395
-
396
-
397
-
398
-
399
-
400
-
401
-
402
-
403
-
404
-
405
-
406
-
407
-
408
-
409
-
410
-
411
-
412
-
413
-
414
-
415
-
416
-
417
-
418
-
419
-
420
-
421
-
422
-
423
-
424
-
425
-
426
-
427
-
428
-
429
-
430
-
431
-
432
-
433
-
434
-
435
-
436
-
437
-
438
-
439
-
440
-
441
-
442
-
443
-
444
-
445
-
446
-
447
-
448
-
449
-
450
-
451
-
452
-
453
-
454
-
455
-
456
-
457
-
458
-
459
-
460
-
461
-
462
-
463
-
464
-
465
-
466
-
467
-
468
-
469
-
470
-
471
-
472
-
473
-
474
-
475
-
476
-
477
-
478
-
479
-
480
-
481
-
482
-
483
-
484
-
485
-
486
-
487
-
488
-
489
-
490
-
491
-
492
-
493
-
494
-
495
-
496
-
497
-
498
-
499
-
500
-
501
-
502
-
503
-
504
-
505
-
506
-
507
-
508
-
509
-
510
-
511
-
512
-
513
-
514
-
515
-
516
-
517
-
518
-
519
-
520
-
521
-
522
-
523
-
524
-
525
-
526
-
527
-
528
-
529
-
530
-
531
-
532
-
533
-
534
-
535
-
536
-
537
-
538
-
539
-
540
-
541
-
542
-
543
-
544
-
545
-
546
 |
 |

43
Overview Operating & Financial Review Corporate Governance Financial Statements Shareholder Information
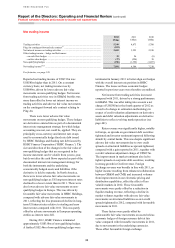
Reported operating expenses of US$42.9bn were
US$1.4bn or 3% higher than in 2011. On an
underlying basis, costs increased by 11%.
On a constant currency basis, operating
expenses in 2012 were US$2.7bn or 7% higher than
in 2011, primarily driven by fines and penalties paid
as part of the settlement of investigations into past
inadequate compliance with anti-money laundering
and sanction laws of US$1.9bn, of which US$1.5bn
was attributed to, and paid by, HSBC North America
Holdings Inc. (‘HNAH’) and its subsidiaries and
US$375m was paid by HSBC Holdings. Further
provisions for the UK customer redress programmes
of US$2.3bn were raised during 2012 compared
with a charge of US$890m in 2011 (US$898m as
reported). This included a charge for additional
estimated redress for possible mis-selling in previous
years of PPI policies US$1.7bn (2011: US$713m)
and interest rate protection products (US$598m),
which took the balance sheet provision for the UK
customer redress programmes at 31 December 2012
to US$2.2bn.
In 2011 we recorded a credit of US$570m
(US$587m as reported) following a change in the
inflation measure used to calculate the defined
benefit obligation in the UK for deferred pensions
which did not recur in 2012.
Costs also rose due to inflationary pressures in
certain of our Latin American and Asian markets and
increased investment costs in strategic initiatives,
including certain business expansion projects, and in
enhanced processes and technology capabilities. We
also increased investment in our regulatory and
compliance infrastructure primarily in the US.
The above increases in costs were mitigated by
strict cost control and the continued delivery of our
organisational effectiveness programmes, which
resulted in sustainable cost savings of US$2.0bn.
The number of employees (expressed in FTEs) at the
end of the 2012 was 10% lower than at the end of
2011. This reflected the planned net reduction of
staff numbers across the Group from organisational
effectiveness initiatives and business disposals. In
2012, average FTEs fell by 7%.
Business disposals in 2011 and 2012 resulted in
a lower cost base, most significantly from the sale of
the Card and Retail Services business and the 195
branches in the US.
Restructuring and other related costs were
US$876m in 2012 compared with US$1.1bn in 2011
(US$1.1bn as reported).
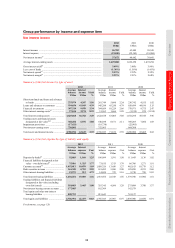
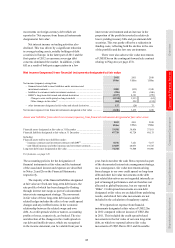
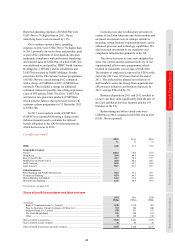
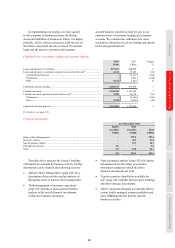
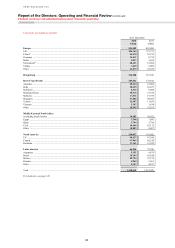
Cost efficiency ratios4
2012
%
2011
%
2010
%
HSBC ......................................................................................................................... 62.8 57.5 55.2
Geographical regions
Europe ........................................................................................................................ 108.4 70.4 67.9
Hong Kong ................................................................................................................. 39.0 44.5 43.4
Rest of Asia-Pacific .................................................................................................... 42.7 54.2 55.7
Middle East and North Africa .................................................................................... 48.0 44.5 44.7
North America ............................................................................................................ 60.8 55.7 48.8
Latin America ............................................................................................................. 58.7 63.3 65.7
Global businesses
Retail Banking and Wealth Management .................................................................. 58.4 63.2 58.1
Commercial Banking ................................................................................................. 45.9 46.3 49.4
Global Banking and Markets ..................................................................................... 54.2 57.0 48.8
Global Private Banking .............................................................................................. 67.6 68.8 65.8
For footnote, see page 120.
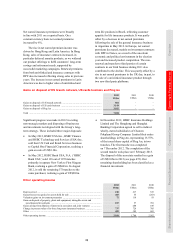
Share of profit in associates and joint ventures
2012
US$m
2011
US$m
2010
US$m
Associates
Bank of Communications Co., Limited ................................................................. 1,670 1,370 987
Ping An Insurance (Group) Company of China, Ltd ............................................. 763 946 848
Industrial Bank Co., Limited .................................................................................. 670 471 327
The Saudi British Bank .......................................................................................... 346 308 161
Other ....................................................................................................................... 72 126 156
Share of profit in associates ........................................................................................ 3,521 3,221 2,479
Share of profit in joint ventures .................................................................................. 36 43 38
Share of profit in associates and joint ventures .......................................................... 3,557 3,264 2,517