HSBC 2012 Annual Report Download - page 124
Download and view the complete annual report
Please find page 124 of the 2012 HSBC annual report below. You can navigate through the pages in the report by either clicking on the pages listed below, or by using the keyword search tool below to find specific information within the annual report.-
 1
1 -
2
-
3
-
4
-
5
-
6
-
7
-
8
-
9
-
10
-
11
-
12
-
13
-
14
-
15
-
16
-
17
-
18
-
19
-
20
-
21
-
22
-
23
-
24
-
25
-
26
-
27
-
28
-
29
-
30
-
31
-
32
-
33
-
34
-
35
-
36
-
37
-
38
-
39
-
40
-
41
-
42
-
43
-
44
-
45
-
46
-
47
-
48
-
49
-
50
-
51
-
52
-
53
-
54
-
55
-
56
-
57
-
58
-
59
-
60
-
61
-
62
-
63
-
64
-
65
-
66
-
67
-
68
-
69
-
70
-
71
-
72
-
73
-
74
-
75
-
76
-
77
-
78
-
79
-
80
-
81
-
82
-
83
-
84
-
85
-
86
-
87
-
88
-
89
-
90
-
91
-
92
-
93
-
94
-
95
-
96
-
97
-
98
-
99
-
100
-
101
-
102
-
103
-
104
-
105
-
106
-
107
-
108
-
109
-
110
-
111
-
112
-
113
-
 114
114 -
 115
115 -
 116
116 -
 117
117 -
 118
118 -
 119
119 -
 120
120 -
 121
121 -
 122
122 -
 123
123 -
 124
124 -
 125
125 -
 126
126 -
 127
127 -
 128
128 -
 129
129 -
 130
130 -
 131
131 -
 132
132 -
 133
133 -
 134
134 -
135
-
136
-
137
-
138
-
139
-
140
-
141
-
142
-
143
-
144
-
145
-
146
-
147
-
148
-
149
-
150
-
151
-
152
-
153
-
154
-
155
-
156
-
157
-
158
-
159
-
160
-
161
-
162
-
163
-
164
-
165
-
166
-
167
-
168
-
169
-
170
-
171
-
172
-
173
-
174
-
175
-
176
-
177
-
178
-
179
-
180
-
181
-
182
-
183
-
184
-
185
-
186
-
187
-
188
-
189
-
190
-
191
-
192
-
193
-
194
-
195
-
196
-
197
-
198
-
199
-
200
-
201
-
202
-
203
-
204
-
205
-
206
-
207
-
208
-
209
-
210
-
211
-
212
-
213
-
214
-
215
-
216
-
217
-
218
-
219
-
220
-
221
-
222
-
223
-
224
-
225
-
226
-
227
-
228
-
229
-
230
-
231
-
232
-
233
-
234
-
235
-
236
-
237
-
238
-
239
-
240
-
241
-
242
-
243
-
244
-
245
-
246
-
247
-
248
-
249
-
250
-
251
-
252
-
253
-
254
-
255
-
256
-
257
-
258
-
259
-
260
-
261
-
262
-
263
-
264
-
265
-
266
-
267
-
268
-
269
-
270
-
271
-
272
-
273
-
274
-
275
-
276
-
277
-
278
-
279
-
280
-
281
-
282
-
283
-
284
-
285
-
286
-
287
-
288
-
289
-
290
-
291
-
292
-
293
-
294
-
295
-
296
-
297
-
298
-
299
-
300
-
301
-
302
-
303
-
304
-
305
-
306
-
307
-
308
-
309
-
310
-
311
-
312
-
313
-
314
-
315
-
316
-
317
-
318
-
319
-
320
-
321
-
322
-
323
-
324
-
325
-
326
-
327
-
328
-
329
-
330
-
331
-
332
-
333
-
334
-
335
-
336
-
337
-
338
-
339
-
340
-
341
-
342
-
343
-
344
-
345
-
346
-
347
-
348
-
349
-
350
-
351
-
352
-
353
-
354
-
355
-
356
-
357
-
358
-
359
-
360
-
361
-
362
-
363
-
364
-
365
-
366
-
367
-
368
-
369
-
370
-
371
-
372
-
373
-
374
-
375
-
376
-
377
-
378
-
379
-
380
-
381
-
382
-
383
-
384
-
385
-
386
-
387
-
388
-
389
-
390
-
391
-
392
-
393
-
394
-
395
-
396
-
397
-
398
-
399
-
400
-
401
-
402
-
403
-
404
-
405
-
406
-
407
-
408
-
409
-
410
-
411
-
412
-
413
-
414
-
415
-
416
-
417
-
418
-
419
-
420
-
421
-
422
-
423
-
424
-
425
-
426
-
427
-
428
-
429
-
430
-
431
-
432
-
433
-
434
-
435
-
436
-
437
-
438
-
439
-
440
-
441
-
442
-
443
-
444
-
445
-
446
-
447
-
448
-
449
-
450
-
451
-
452
-
453
-
454
-
455
-
456
-
457
-
458
-
459
-
460
-
461
-
462
-
463
-
464
-
465
-
466
-
467
-
468
-
469
-
470
-
471
-
472
-
473
-
474
-
475
-
476
-
477
-
478
-
479
-
480
-
481
-
482
-
483
-
484
-
485
-
486
-
487
-
488
-
489
-
490
-
491
-
492
-
493
-
494
-
495
-
496
-
497
-
498
-
499
-
500
-
501
-
502
-
503
-
504
-
505
-
506
-
507
-
508
-
509
-
510
-
511
-
512
-
513
-
514
-
515
-
516
-
517
-
518
-
519
-
520
-
521
-
522
-
523
-
524
-
525
-
526
-
527
-
528
-
529
-
530
-
531
-
532
-
533
-
534
-
535
-
536
-
537
-
538
-
539
-
540
-
541
-
542
-
543
-
544
-
545
-
546
 |
 |

HSBC HOLDINGS PLC
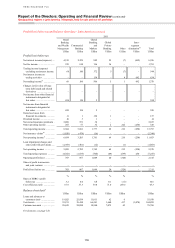
Report of the Directors: Operating and Financial Review (continued)
Footnotes // Risk > Risk profile
122
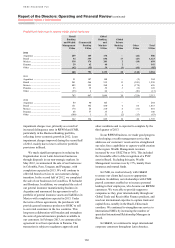
Reconciliation of RoRWA measures
66 Risk-weighted assets (‘RWA’s) and pre-tax return on average risk-weighted assets (‘RoRWA’).
67 Underlying RoRWA is calculated using underlying pre-tax return and reported average RWAs at constant currency and adjusted for the
effects of business disposals.
68 ‘Other’ includes treasury services related to the US Consumer and Mortgage Lending business and commercial operations in run-off.
US CML includes loan portfolios within the run-off business that are designated held for sale.
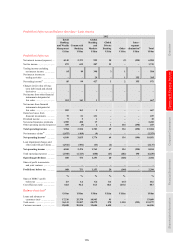
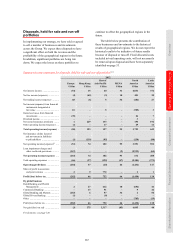
Disposals, held for sale and run-off portfolios
69 The results of operations of disposed businesses are stated up to and including the date of disposal. The results of operations of
businesses held for sale and run-off portfolios are for 2012.
70 The summary income statements present the historical results of disposals, held-for-sale and run-off portfolios to provide information
on trends. The historical results are those which appear in the Group IFRS income statement and include fixed allocated costs which
will not necessarily be removed or reduced upon disposal or run-off. Fixed allocated costs included in total operating expenses are
disclosed separately on page 38. The results of disposed businesses exclude gains on sale and post disposal income and expenditure
items; for example, restructuring costs. The results of businesses held for sale exclude losses recognised upon reclassification to the
held-for-sale category. These losses are disclosed in Note 26 on the Financial Statements.
71 ‘US CML’ includes non-real estate personal loans that were reclassified to ‘Assets held for sale’ during 2012. At 31 December 2012, the
carrying value of this portfolio, net of transferred impairment allowances, was US$3.4bn. The portfolio contributed interest income of
US$813m and loan impairment charges of US$347m to profit before tax in 2012. ‘Other’ includes treasury services related to the US
Consumer and Mortgage Lending business and commercial operations in run-off.
72 ‘Reduction in RWAs on disposal’ for disposal and held-for-sale portfolios are shown exclusive of operational risk RWAs as these are not
immediately released on disposal. RWAs for held-for-sale and run-off portfolios are shown inclusive of operational risk RWAs.
Global businesses and geographical regions
73 The main items reported under ‘Other’ are certain property activities, unallocated investment activities, centrally held investment
companies, gains arising from the dilution of interests in associates and joint ventures, part of the movement in the fair value of our
long-term debt designated at fair value (the remainder of the Group’s movement on own debt is included in GB&M) and HSBC’s
holding company and financing operations. The results also include net interest earned on free capital held centrally, operating costs
incurred by the head office operations in providing stewardship and central management services to HSBC, and costs incurred by the
Group Service Centres and Shared Service Organisations and associated recoveries. In addition, fines and penalties as part of the
settlement of investigations into past inadequate compliance with anti-money laundering and sanctions laws together with the UK bank
levy are recorded in ‘Other’.
74 Assets by geographical region and global businesses include intra-HSBC items. These items are eliminated, where appropriate, under
the heading ‘Intra-HSBC items’ or ‘inter-segment elimination’, as appropriate.
75 For divested businesses, this includes the gain or loss on disposal and material results of operations as described on page 26.
76 Loan impairment charges and other credit risk provisions.
77 Share of profit in associates and joint ventures.
78 In the analysis of global businesses, net trading income comprises all gains and losses from changes in the fair value of financial assets
and financial liabilities classified as held for trading, together with related external and internal interest income and interest expense,
and dividends received; in the statutory presentation internal interest income and expense are eliminated.
79 In 2012, Global Markets included an adverse fair value movement of US$629m on the widening of credit spreads on structured
liabilities (2011: favourable fair value movement of US$458m; 2010: favourable fair value movement of US$23m).
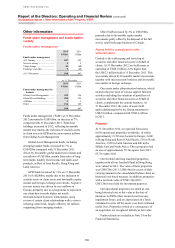
80 Total income earned on payments and cash management products in the Group amounted to US$6.2bn (2011: US$5.6bn; 2010:
US$4.4bn), of which US$4.5bn was in CMB (2011: US$4.0bn; 2010: US$3.3bn) and US$1.7bn was in GB&M (2011: US$1.5bn; 2010:
US$1.1bn).
81 Total income earned on other transaction services in the Group amounted to US$3.6bn (2011: US$3.2bn; 2010: US$2.7bn), of which
US$2.8bn was in CMB relating to trade and receivables finance (2011: US$2.6bn; 2010: US$2.1bn) and US$753m was in GB&M of
which US$738m related to trade and receivables finance (2011: US$601m; 2010: US$523m) and US$15m related to banknotes and
other (2011: US$33m; 2010: US$113m).
82 In each Group entity, Balance Sheet Management is responsible for managing liquidity and funding under the supervision of the local
Asset and Liability Management Committee. Balance Sheet Management also manages the non-trading interest rate positions of the
entity transferred to it within a Global Markets limit structure. Balance Sheet Management revenues include notional tax credits on
income earned from tax-exempt investments of US$116m in 2012, US$85m in 2011 and US$50m in 2010, which are offset within
‘Other’.
83 ‘Other’ in GB&M includes net interest earned on free capital held in the global business not assigned to products, allocated funding
costs and gains resulting from business disposals. Within the management view of total operating income, notional tax credits are
allocated to the businesses to reflect the economic benefit generated by certain activities which is not reflected within operating income,
for example notional credits on income earned from tax-exempt investments where the economic benefit of the activity is reflected in tax
expense. In order to reflect the total operating income on an IFRS basis, the offset to these tax credits are included within ‘Other’.
84 ‘Client assets’ are translated at the rates of exchange applicable for their respective period-ends, with the effects of currency translation
reported separately. The main components of client assets are funds under management, which are not reported on the Group’s balance
sheet, and customer deposits, which are reported on the Group’s balance sheet.
85 Inter-segment elimination comprises (i) the costs of shared services and Group Service Centres included within ‘Other’ which are
recovered from global businesses, and (ii) the intra-segment funding costs of trading activities undertaken within GB&M. HSBC’s
Balance Sheet Management business, reported within GB&M, provides funding to the trading businesses. To report GB&M’s ‘Net
trading income’ on a fully funded basis, ‘Net interest income’ and ‘Net interest income/(expense) on trading activities’ are grossed up to
reflect internal funding transactions prior to their elimination in the inter-segment column.
86 Net insurance claims incurred and movement in liabilities to policyholders.
87 ‘Employee expenses’ comprise costs directly incurred by each global business. The reallocation and recharging of employee and other
expenses directly incurred in the ‘Other’ category are shown in ‘Other operating expenses’.
88 RWAs are non-additive across geographical regions due to market risk diversification effects within the Group.
89 CMB results include US$128m (2011: US$110m) of net operating income and US$43m (2011: US$23m) of profit before tax, related to
low income housing tax credit investments in the US which are offset within the ‘Other’ segment.