HSBC 2012 Annual Report Download - page 123
Download and view the complete annual report
Please find page 123 of the 2012 HSBC annual report below. You can navigate through the pages in the report by either clicking on the pages listed below, or by using the keyword search tool below to find specific information within the annual report.-
 1
1 -
2
-
3
-
4
-
5
-
6
-
7
-
8
-
9
-
10
-
11
-
12
-
13
-
14
-
15
-
16
-
17
-
18
-
19
-
20
-
21
-
22
-
23
-
24
-
25
-
26
-
27
-
28
-
29
-
30
-
31
-
32
-
33
-
34
-
35
-
36
-
37
-
38
-
39
-
40
-
41
-
42
-
43
-
44
-
45
-
46
-
47
-
48
-
49
-
50
-
51
-
52
-
53
-
54
-
55
-
56
-
57
-
58
-
59
-
60
-
61
-
62
-
63
-
64
-
65
-
66
-
67
-
68
-
69
-
70
-
71
-
72
-
73
-
74
-
75
-
76
-
77
-
78
-
79
-
80
-
81
-
82
-
83
-
84
-
85
-
86
-
87
-
88
-
89
-
90
-
91
-
92
-
93
-
94
-
95
-
96
-
97
-
98
-
99
-
100
-
101
-
102
-
103
-
104
-
105
-
106
-
107
-
108
-
109
-
110
-
111
-
112
-
 113
113 -
 114
114 -
 115
115 -
 116
116 -
 117
117 -
 118
118 -
 119
119 -
 120
120 -
 121
121 -
 122
122 -
 123
123 -
 124
124 -
 125
125 -
 126
126 -
 127
127 -
 128
128 -
 129
129 -
 130
130 -
 131
131 -
 132
132 -
 133
133 -
134
-
135
-
136
-
137
-
138
-
139
-
140
-
141
-
142
-
143
-
144
-
145
-
146
-
147
-
148
-
149
-
150
-
151
-
152
-
153
-
154
-
155
-
156
-
157
-
158
-
159
-
160
-
161
-
162
-
163
-
164
-
165
-
166
-
167
-
168
-
169
-
170
-
171
-
172
-
173
-
174
-
175
-
176
-
177
-
178
-
179
-
180
-
181
-
182
-
183
-
184
-
185
-
186
-
187
-
188
-
189
-
190
-
191
-
192
-
193
-
194
-
195
-
196
-
197
-
198
-
199
-
200
-
201
-
202
-
203
-
204
-
205
-
206
-
207
-
208
-
209
-
210
-
211
-
212
-
213
-
214
-
215
-
216
-
217
-
218
-
219
-
220
-
221
-
222
-
223
-
224
-
225
-
226
-
227
-
228
-
229
-
230
-
231
-
232
-
233
-
234
-
235
-
236
-
237
-
238
-
239
-
240
-
241
-
242
-
243
-
244
-
245
-
246
-
247
-
248
-
249
-
250
-
251
-
252
-
253
-
254
-
255
-
256
-
257
-
258
-
259
-
260
-
261
-
262
-
263
-
264
-
265
-
266
-
267
-
268
-
269
-
270
-
271
-
272
-
273
-
274
-
275
-
276
-
277
-
278
-
279
-
280
-
281
-
282
-
283
-
284
-
285
-
286
-
287
-
288
-
289
-
290
-
291
-
292
-
293
-
294
-
295
-
296
-
297
-
298
-
299
-
300
-
301
-
302
-
303
-
304
-
305
-
306
-
307
-
308
-
309
-
310
-
311
-
312
-
313
-
314
-
315
-
316
-
317
-
318
-
319
-
320
-
321
-
322
-
323
-
324
-
325
-
326
-
327
-
328
-
329
-
330
-
331
-
332
-
333
-
334
-
335
-
336
-
337
-
338
-
339
-
340
-
341
-
342
-
343
-
344
-
345
-
346
-
347
-
348
-
349
-
350
-
351
-
352
-
353
-
354
-
355
-
356
-
357
-
358
-
359
-
360
-
361
-
362
-
363
-
364
-
365
-
366
-
367
-
368
-
369
-
370
-
371
-
372
-
373
-
374
-
375
-
376
-
377
-
378
-
379
-
380
-
381
-
382
-
383
-
384
-
385
-
386
-
387
-
388
-
389
-
390
-
391
-
392
-
393
-
394
-
395
-
396
-
397
-
398
-
399
-
400
-
401
-
402
-
403
-
404
-
405
-
406
-
407
-
408
-
409
-
410
-
411
-
412
-
413
-
414
-
415
-
416
-
417
-
418
-
419
-
420
-
421
-
422
-
423
-
424
-
425
-
426
-
427
-
428
-
429
-
430
-
431
-
432
-
433
-
434
-
435
-
436
-
437
-
438
-
439
-
440
-
441
-
442
-
443
-
444
-
445
-
446
-
447
-
448
-
449
-
450
-
451
-
452
-
453
-
454
-
455
-
456
-
457
-
458
-
459
-
460
-
461
-
462
-
463
-
464
-
465
-
466
-
467
-
468
-
469
-
470
-
471
-
472
-
473
-
474
-
475
-
476
-
477
-
478
-
479
-
480
-
481
-
482
-
483
-
484
-
485
-
486
-
487
-
488
-
489
-
490
-
491
-
492
-
493
-
494
-
495
-
496
-
497
-
498
-
499
-
500
-
501
-
502
-
503
-
504
-
505
-
506
-
507
-
508
-
509
-
510
-
511
-
512
-
513
-
514
-
515
-
516
-
517
-
518
-
519
-
520
-
521
-
522
-
523
-
524
-
525
-
526
-
527
-
528
-
529
-
530
-
531
-
532
-
533
-
534
-
535
-
536
-
537
-
538
-
539
-
540
-
541
-
542
-
543
-
544
-
545
-
546
 |
 |

121
Overview Operating & Financial Review Corporate Governance Financial Statements Shareholder Information
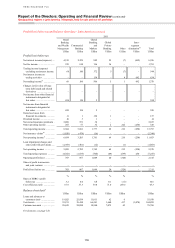
attributable to credit spread. The inclusion of acquisitions and disposals is determined in the light of events each year.
33 Excluding adjustments in 2010.
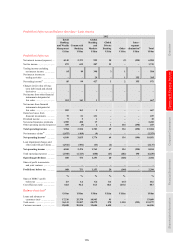
Financial summary
34 In 2008, an impairment charge of US$10,564m to fully write off goodwill in PFS in North America was reported in ‘Total operating
expenses’. This amount is excluded from ‘Total operating expenses’ in calculating the ratio.
35 The effect of the bonus element of the rights issue in 2009 has been included within the basic and diluted earnings per share.
36 Dividends per ordinary share expressed as a percentage of basic earnings per share.
37 For full description of the Ping An forward contract, see page 470.
38 In 2011, ‘Deferred variable compensation awards-accelerated amortisation’ was included as a notable cost item. In 2012, this item
recurs but is now considered part of our operating cost base and therefore has been excluded from notable items in both years.
39 Net interest income includes the cost of funding trading assets, while the related external revenues are reported in ‘Trading income’.
In our global business results, the cost of funding trading assets is included with GB&M’s net trading income as interest expense.
40 Gross interest yield is the average annualised interest rate earned on average interest-earning assets (‘AIEA’).
41 Net interest spread is the difference between the average annualised interest rate earned on AIEA, net of amortised premiums and loan
fees, and the average annualised interest rate paid on average interest-bearing funds.
42 Net interest margin is net interest income expressed as an annualised percentage of AIEA.
43 In 2011, ‘Other interest-earning assets’ includes the average assets of disposal groups held for sale. In prior years other interest-
earning assets included intercompany eliminations. In 2012, intercompany eliminations have been included in the relevant line item.
44 Interest income on trading assets is reported as ‘Net trading income’ in the consolidated income statement.
45 Interest income on financial assets designated at fair value is reported as ‘Net income from financial instruments designated at fair
value’ in the consolidated income statement.
46 Including interest-bearing bank deposits only.
47 Interest expense on financial liabilities designated at fair value is reported as ‘Net income on financial instruments designated at fair
value’ in the consolidated income statement, other than interest on own debt which is reported in ‘Interest expense’.
48 Including interest-bearing customer accounts only.
49 The cost of internal funding of trading assets was US$511m (2011: US$1,161m; 2010: US$902m) and is excluded from the reported
‘Net trading income’ line and included in ‘Net interest income’. However, this cost is reinstated in ‘Net trading income’ in our global
business reporting.
50 Net trading income includes a charge of US$629m (2011: income of US$458m; 2010: income of US$23m), associated with changes in
the fair value of issued structured notes and other hybrid instrument liabilities derived from movements in HSBC issuance spreads.
51 Other changes in fair value include gains and losses arising from changes in the fair value of derivatives that are managed in
conjunction with HSBC’s long-term debt issued.
52 Discretionary participation features.
53 Net insurance claims incurred and movement in liabilities to policyholders arise from both life and non-life insurance business. For
non-life business, amounts reported represent the cost of claims paid during the year and the estimated cost of notified claims. For life
business, the main element of claims is the liability to policyholders created on the initial underwriting of the policy and any subsequent
movement in the liability that arises, primarily from the attribution of investment performance to savings-related policies. Consequently,
claims rise in line with increases in sales of savings-related business and with investment market growth.
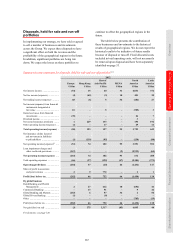
Consolidated balance sheet
54 Net of impairment allowances.
55 The calculation of capital resources, capital ratios and risk-weighted assets for 2012 and 2011 is on a Basel 2.5 basis. All other
comparatives are on a Basel II basis.
56 Capital resources are total regulatory capital, the calculation of which is set out on page 286.
57 Including perpetual preferred securities, details of which can be found in Note 33 on the Financial Statements.
58 The definition of net asset value per share is total shareholders’ equity, less non-cumulative preference shares and capital securities,
divided by the number of ordinary shares in issue.
59 ‘Currency translation adjustment’ is the effect of translating the assets and liabilities of subsidiaries and associates for the previous
year-end at the rates of exchange applicable at the current year-end.
60 See Note 26 on the Financial Statements.
61 France primarily comprises the domestic operations of HSBC France, HSBC Assurances Vie and the Paris branch of HSBC Bank plc.
62 The classification of customer accounts by country within Europe has changed from amounts formerly disclosed. Certain balances
which were previously presented within the country of domicile of the consolidating legal entity are now presented on the basis of the
country of account origination. The most significant effect of this change is on Switzerland, where the balance of US$45,283m
previously disclosed at 31 December 2011 has been restated as US$19,888m on the new basis.
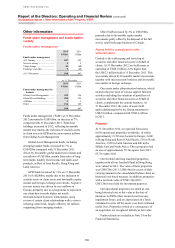
Economic profit
63 Expressed as a percentage of average invested capital.
64 Average invested capital is measured as average total shareholders’ equity after:
– adding back the average balance of goodwill amortised pre-transition to IFRSs or subsequently written-off, directly to reserves (less
goodwill previously amortised in respect of the French regional banks sold in 2008);
– deducting the average balance of HSBC’s revaluation surplus relating to property held for own use. This reserve was generated when
determining the deemed carrying cost of such properties on transition to IFRSs and will run down over time as the properties are sold;
– deducting average preference shares and other equity instruments issued by HSBC Holdings; and
– deducting average reserves for unrealised gains/(losses) on effective cash flow hedges and available-for-sale securities.
65 Return on invested capital is profit attributable to ordinary shareholders of the parent company, which can be found in Note 11 on the
Financial Statements on page 426.