Entergy 2007 Annual Report Download - page 99
Download and view the complete annual report
Please find page 99 of the 2007 Entergy annual report below. You can navigate through the pages in the report by either clicking on the pages listed below, or by using the keyword search tool below to find specific information within the annual report.-
 1
1 -
2
-
3
-
4
-
5
-
6
-
7
-
8
-
9
-
10
-
11
-
12
-
13
-
14
-
15
-
16
-
17
-
18
-
19
-
20
-
21
-
22
-
23
-
24
-
25
-
26
-
27
-
28
-
29
-
30
-
31
-
32
-
33
-
34
-
35
-
36
-
37
-
38
-
39
-
40
-
41
-
42
-
43
-
44
-
45
-
46
-
47
-
48
-
49
-
50
-
51
-
52
-
53
-
54
-
55
-
56
-
57
-
58
-
59
-
60
-
61
-
62
-
63
-
64
-
65
-
66
-
67
-
68
-
69
-
70
-
71
-
72
-
73
-
74
-
75
-
76
-
77
-
78
-
79
-
80
-
81
-
82
-
83
-
84
-
85
-
86
-
87
-
88
-
 89
89 -
 90
90 -
 91
91 -
 92
92 -
 93
93 -
 94
94 -
 95
95 -
 96
96 -
 97
97 -
 98
98 -
 99
99 -
 100
100 -
 101
101 -
 102
102 -
 103
103 -
 104
104
 |
 |

97
Entergy Corporation and Subsidiaries 2007
may be exercised and the relationship between the current market
price of the underlying instrument and the option’s contractual strike
or exercise price also aects the level of market risk. A signicant
factor inuencing the overall level of market risk to which Entergy is
exposed is its use of hedging techniques to mitigate such risk. Entergy
manages market risk by actively monitoring compliance with stated
risk management policies as well as monitoring the eectiveness of
its hedging policies and strategies. Entergy’s risk management policies
limit the amount of total net exposure and rolling net exposure during
the stated periods. ese policies, including related risk limits, are
regularly assessed to ensure their appropriateness given Entergy’s
objectives.
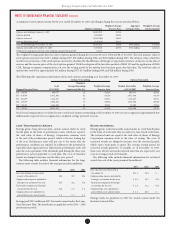
Hedging Derivatives
Entergy classies substantially all of the following types of derivative
instruments held by its consolidated businesses as cash ow hedges:
Instrument Business
Natural gas and electricity futures, forwards, Non-Utility Nuclear,
and options Non-Nuclear Wholesale Assets
Foreign currency forwards Utility, Non-Utility Nuclear
Cash ow hedges with net unrealized gains of approximately $5.4
million (net-of-tax) at December 31, 2007 are scheduled to mature
during 2008. Net losses totaling approximately $63 million were
realized during 2007 on the maturity of cash ow hedges. Unrealized
gains or losses result from hedging power output at the Non-Utility
Nuclear power stations and foreign currency hedges related to Euro-
denominated nuclear fuel acquisitions. The related gains or losses from
hedging power are included in revenues when realized. The realized
gains or losses from foreign currency transactions are included in
the cost of capitalized fuel. The maximum length of time over which
Entergy is currently hedging the variability in future cash ows for
forecasted transactions at December 31, 2007 is approximately ve
years. The ineffective portion of the change in the value of Entergy’s
cash ow hedges during 2007, 2006, and 2005 was insignicant.
Fair Values
Financial Instruments
e estimated fair value of Entergy’s nancial instruments is
determined using forward mid curves. ese independent market
curves are periodically compared to NYMEX Clearport prices where
available and have been found to be materially identical. Additional
adjustments for unit contingent discounts and/or price dierentials
between liquid market locations and plant busbars are internally
determined and applied depending on settlement terms of the nancial
instrument. In determining these adjustments, Entergy uses a process
that estimates the forward values based on recent observed history.
Due largely to the potential for market or product illiquidity, forward
estimates are not necessarily indicative of the amounts that Entergy
could realize in a current market exchange. In addition, gains or losses
realized on nancial instruments held by regulated businesses may be
reected in future rates and therefore do not necessarily accrue to the
benet or detriment of stockholders.
Entergy considers the carrying amounts of most of its nancial
instruments classied as current assets and liabilities to be a reasonable
estimate of their fair value because of the short maturity of these
instruments. Additional information regarding nancial instruments
and their fair values is included in Notes 5 and 6 to the nancial
statements.
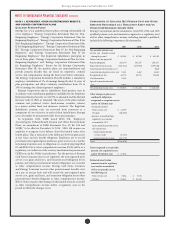
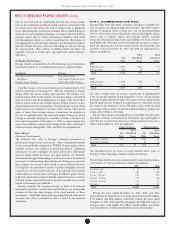
NOTE 17. DECOMMISSIONING TRUST FUNDS
Entergy holds debt and equity securities, classied as available-for-
sale, in nuclear decommissioning trust accounts. e NRC requires
Entergy to maintain trusts to fund the costs of decommissioning
ANO 1, ANO 2, River Bend, Waterford 3, Grand Gulf, Pilgrim, Indian
Point 1 and 2, Vermont Yankee, and Palisades (NYPA currently
retains the decommissioning trusts and liabilities for Indian Point 3
and FitzPatrick). e funds are invested primarily in equity securities;
xed-rate, xed-income securities; and cash and cash equivalents. e
securities held at December 31, 2007 and 2006 are summarized as
follows (in millions):
Total Total
Fair Unrealized Unrealized
Value Gains Losses
2007
Equity Securities $1,928 $466 $ 9
Debt Securities 1,380 40 3
Total $3,308 $506 $12
2006
Equity Securities $1,706 $418 $ 2
Debt Securities 1,153 17 11
Total $2,859 $435 $13
e debt securities have an average coupon rate of approximately
5.2%, an average duration of approximately 5.5 years, and an average
maturity of approximately 8.9 years. e equity securities are generally
held in funds that are designed to approximate or somewhat exceed
the return of the Standard & Poor’s 500 Index, and a relatively small
percentage of the securities are held in a fund intended to replicate the
return of the Wilshire 4500 Index.
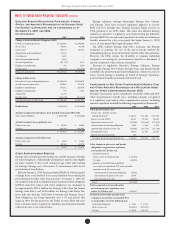
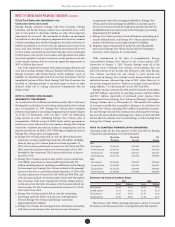
e fair value and gross unrealized losses of available-for-sale equity
and debt securities, summarized by investment type and length of
time that the securities have been in a continuous loss position, are as
follows at December 31, 2007 (in millions):
Equity Securities Debt Securities
Gross Gross
Fair Unrealized Fair Unrealized
Value Losses Value Losses
Less than 12 months $170 $9 $124 $2
More than 12 months – – 35 1
Total $170 $9 $159 $3
e unrealized losses in excess of twelve months above relate to
Entergy’s Utility operating companies and System Energy.
e fair value of debt securities, summarized by contractual maturities,
at December 31, 2007 and 2006 are as follows (in millions):
2007 2006
less than 1 year $ 83 $ 82
1 year – 5 years 388 309
5 years – 10 years 535 472
10 years – 15 years 127 106
15 years – 20 years 81 72
20 years+ 166 112
Total $1,380 $1,153
During the years ended December 31, 2007, 2006, and 2005,
proceeds from the dispositions of securities amounted to $1,583 million,
$778 million, and $944 million, respectively. During the years ended
December 31, 2007, 2006, and 2005, gross gains of $5 million in each year
and gross losses of $4 million, $10 million, and $8 million, respectively,
were reclassied out of other comprehensive income into earnings.
Notes to Consolidated Financial Statements continued