Entergy 2007 Annual Report Download - page 3
Download and view the complete annual report
Please find page 3 of the 2007 Entergy annual report below. You can navigate through the pages in the report by either clicking on the pages listed below, or by using the keyword search tool below to find specific information within the annual report.-
 1
1 -
 2
2 -
 3
3 -
 4
4 -
 5
5 -
 6
6 -
 7
7 -
 8
8 -
 9
9 -
 10
10 -
 11
11 -
 12
12 -
 13
13 -
 14
14 -
15
-
16
-
17
-
18
-
19
-
20
-
21
-
22
-
23
-
24
-
25
-
26
-
27
-
28
-
29
-
30
-
31
-
32
-
33
-
34
-
35
-
36
-
37
-
38
-
39
-
40
-
41
-
42
-
43
-
44
-
45
-
46
-
47
-
48
-
49
-
50
-
51
-
52
-
53
-
54
-
55
-
56
-
57
-
58
-
59
-
60
-
61
-
62
-
63
-
64
-
65
-
66
-
67
-
68
-
69
-
70
-
71
-
72
-
73
-
74
-
75
-
76
-
77
-
78
-
79
-
80
-
81
-
82
-
83
-
84
-
85
-
86
-
87
-
88
-
89
-
90
-
91
-
92
-
93
-
94
-
95
-
96
-
97
-
98
-
99
-
100
-
101
-
102
-
103
-
104
 |
 |

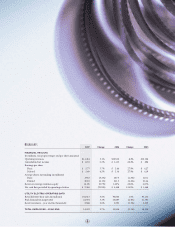
Highlights
2007 Change 2006 Change 2005
FINANCIAL RESULTS
(in millions, except percentages and per share amounts)
Operating revenues $11,484 5.1% $10,932 8.2% $10,106
Consolidated net income $ 1,135 0.2% $ 1,133 26.2% $ 898
Earnings per share
Basic $ 5.77 5.7% $ 5.46 27.9% $ 4.27
Diluted $ 5.60 4.5% $ 5.36 27.9% $ 4.19
Average shares outstanding (in millions)
Basic 196.6 (5.3%) 207.5 (1.2%) 210.1
Diluted 202.8 (4.1%) 211.5 (1.4%) 214.4
Return on average common equity 14.1% (0.7%) 14.2% 26.8% 11.2%
Net cash ow provided by operating activities $ 2,560 (25.8%) $ 3,448 134.9% $ 1,468
UTILITY ELECTRIC OPERATING DATA
Retail kilowatt-hour sales (in millions) 102,013 5.5% 96,663 1.6% 95,153
Peak demand (in megawatts) 22,001 5.3% 20,887 (2.4%) 21,391
Retail customers – year end (in thousands) 2,668 2.8% 2,595 (1.3%) 2,629
TOTAL EMPLOYEES – YEAR END 14,322 3.7% 13,814 (2.3%) 14,136
1