Entergy 2007 Annual Report Download - page 21
Download and view the complete annual report
Please find page 21 of the 2007 Entergy annual report below. You can navigate through the pages in the report by either clicking on the pages listed below, or by using the keyword search tool below to find specific information within the annual report.-
 1
1 -
2
-
3
-
4
-
5
-
6
-
7
-
8
-
9
-
10
-
 11
11 -
 12
12 -
 13
13 -
 14
14 -
 15
15 -
 16
16 -
 17
17 -
 18
18 -
 19
19 -
 20
20 -
 21
21 -
 22
22 -
 23
23 -
 24
24 -
 25
25 -
 26
26 -
 27
27 -
 28
28 -
 29
29 -
 30
30 -
 31
31 -
32
-
33
-
34
-
35
-
36
-
37
-
38
-
39
-
40
-
41
-
42
-
43
-
44
-
45
-
46
-
47
-
48
-
49
-
50
-
51
-
52
-
53
-
54
-
55
-
56
-
57
-
58
-
59
-
60
-
61
-
62
-
63
-
64
-
65
-
66
-
67
-
68
-
69
-
70
-
71
-
72
-
73
-
74
-
75
-
76
-
77
-
78
-
79
-
80
-
81
-
82
-
83
-
84
-
85
-
86
-
87
-
88
-
89
-
90
-
91
-
92
-
93
-
94
-
95
-
96
-
97
-
98
-
99
-
100
-
101
-
102
-
103
-
104
 |
 |
Entergy Corporation and Subsidiaries 2007
19
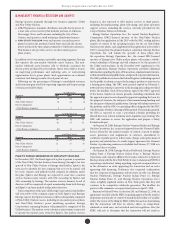
Our Power Marketing Point of View
In 2007, we continued to execute an eective, risk-balanced forward
contracting strategy. We pursue opportunities with natural buyers in the
region who can commit for large blocks of power on a longer-term basis
as well as other counterparties such as nancial buyers. We also maintain
dynamic points of view on key factors including commodity prices, the
regulation of carbon emissions and regional infrastructure and capacity
constraints. As a result, we can layer in hedges on an annual basis consistent
with our dynamic points of view. Our strategy enables us to reserve up to
15 percent for spot market sales. At the end of 2007, 92 percent of our planned
generation for 2008 was under contract, 83 percent for 2009 and 59 percent
for 2010 at average energy prices per MWh of $54, $61 and $58, respectively.
Unlocking the Value: The Future of SpinCo
In 2008, we will pursue the regulatory approvals needed and take action to
complete the separation of our non-utility nuclear business. We are condent
this is the best approach to unlock the full value of these assets for our shareholders.
As an independent company, SpinCo will have the ability to pursue its
optimal capital structure, including executing approximately $4.5 billion in
debt, subject to market terms and conditions. Our positive point of view on
future power pricing trends supports our decision to separate our non-utility
nuclear assets from our utility business. With an optimal capital structure and
a risk prole consistent with a merchant business rather than a utility, SpinCo
will have additional opportunities as it executes its generation hedging strategy.
e existing team of experienced and skilled non-utility nuclear engineers
and operators to be employed by the joint venture owned equally by SpinCo
and Entergy Classic will continue to operate SpinCo nuclear assets. SpinCo
will benet from that operational expertise and the potential that exists to expand
that business by oering nuclear services to third parties. e experienced
and skilled nuclear utility operators will continue to operate the utility nuclear
plants. Retaining the existing operators for the nuclear stations reects our
commitment to maintain safe, secure operations.
We believe SpinCo will be a unique nuclear generation entity with the
potential to deliver $2 billion in earnings before interest, taxes, depreciation
and amortization in 2012. is robust cash projection should generate cash
ow for acquisitions and/or distributions through share repurchases with a
nancial aspiration in the range of $0.5 billion to $1.0 billion annually.
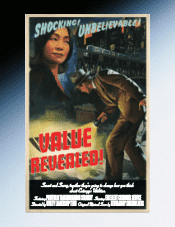
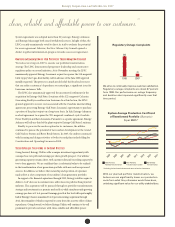
“Our nuclear business offers a significant opportunity for value realization.”
Using our operational and risk management
expertise, we have transformed underperforming
non-utility nuclear assets into a valuable portfolio of
emission-free power-generating assets that are safe
and secure.
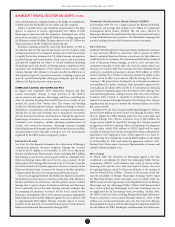
Northeast Nuclear Fleet Production Costs
$ per MWh
Before ETR
ownership
29
2007
21
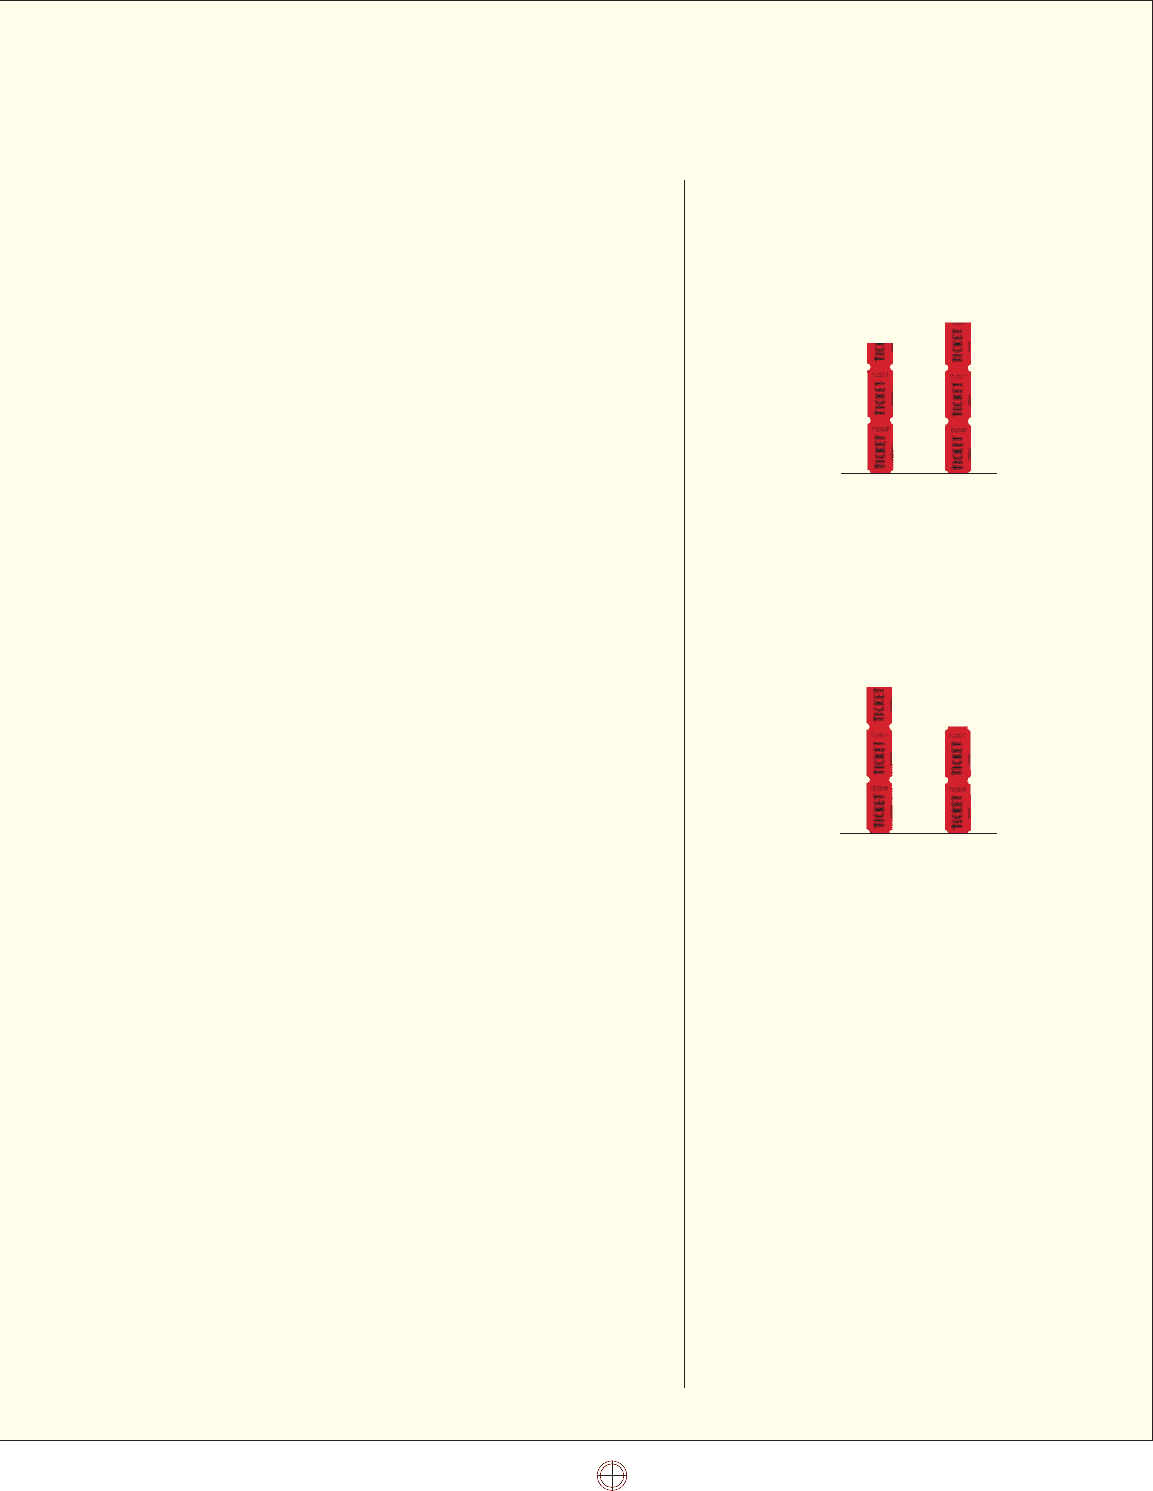
Northeast Nuclear Fleet Capacity Factor
%
Before ETR
ownership
77
2007
89