Entergy 2007 Annual Report Download - page 96
Download and view the complete annual report
Please find page 96 of the 2007 Entergy annual report below. You can navigate through the pages in the report by either clicking on the pages listed below, or by using the keyword search tool below to find specific information within the annual report.-
 1
1 -
2
-
3
-
4
-
5
-
6
-
7
-
8
-
9
-
10
-
11
-
12
-
13
-
14
-
15
-
16
-
17
-
18
-
19
-
20
-
21
-
22
-
23
-
24
-
25
-
26
-
27
-
28
-
29
-
30
-
31
-
32
-
33
-
34
-
35
-
36
-
37
-
38
-
39
-
40
-
41
-
42
-
43
-
44
-
45
-
46
-
47
-
48
-
49
-
50
-
51
-
52
-
53
-
54
-
55
-
56
-
57
-
58
-
59
-
60
-
61
-
62
-
63
-
64
-
65
-
66
-
67
-
68
-
69
-
70
-
71
-
72
-
73
-
74
-
75
-
76
-
77
-
78
-
79
-
80
-
81
-
82
-
83
-
84
-
85
-
 86
86 -
 87
87 -
 88
88 -
 89
89 -
 90
90 -
 91
91 -
 92
92 -
 93
93 -
 94
94 -
 95
95 -
 96
96 -
 97
97 -
 98
98 -
 99
99 -
 100
100 -
 101
101 -
 102
102 -
 103
103 -
 104
104
 |
 |

94
Entergy Corporation and Subsidiaries 2007
Notes to Consolidated Financial Statements continued
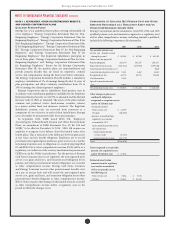
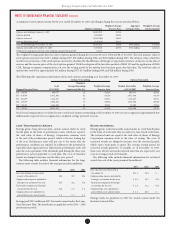
NOTE 13. BUSINESS SEGMENT INFORMATION
Entergy’s reportable segments as of December 31, 2007 are Utility and Non-Utility Nuclear. Utility generates, transmits, distributes, and sells
electric power in portions of Arkansas, Louisiana, Mississippi, and Texas, and provides natural gas utility service in portions of Louisiana.
Non-Utility Nuclear owns and operates six nuclear power plants and is primarily focused on selling electric power produced by those plants
to wholesale customers. “All Other” includes the parent company, Entergy Corporation, and other business activity, including the Energy
Commodity Services segment, the Competitive Retail Services business, and earnings on the proceeds of sales of previously-owned businesses.
As a result of the Entergy New Orleans bankruptcy ling, Entergy discontinued the consolidation of Entergy New Orleans retroactive to
January 1, 2005, and reported Entergy New Orleans results under the equity method of accounting in the Utility segment in 2006 and 2005.
On May 7, 2007, the bankruptcy judge entered an order conrming Entergy New Orleans’ plan of reorganization. With conrmation of the plan
of reorganization, Entergy reconsolidated Entergy New Orleans in the second quarter 2007, retroactive to January 1, 2007.
Eliminations Consolidated
2007
Operating revenues $ 9,255,075 $ 2,029,666 $ 225,216 $ (25,559) $ 11,484,398
Deprec., amort. & decomm. 939,152 177,872 14,586 – 1,131,610
Interest and dividend income 124,992 102,840 88,066 (81,901) 233,997
Equity in earnings of unconsolidated equity aliates (2) – 3,178 – 3,176
Interest and other charges 444,067 34,738 265,253 (81,901) 662,157
Income tax (benets) 382,025 230,407 (98,015) – 514,417
Net income (loss) 682,707 539,200 (87,058) – 1,134,849
Total assets 26,174,159 7,014,484 1,982,429 (1,528,070) 33,643,002
Investment in aliates – at equity 202 – 78,790 – 78,992
Cash paid for long-lived asset additions 1,315,564 258,457 2,754 1,255 1,578,030
2006
Operating revenues $ 9,150,030 $ 1,544,873 $ 275,299 $ (38,044) $ 10,932,158
Deprec., amort. & decomm. 886,537 134,661 12,478 – 1,033,676
Interest and dividend income 112,887 83,155 95,985 (93,192) 198,835
Equity in earnings of unconsolidated equity aliates 4,058 – 89,686 – 93,744
Interest and other charges 428,662 47,424 194,911 (93,192) 577,805
Income tax (benets) 333,105 204,659 (94,720) – 443,044
Loss from discontinued operations – – (496) – (496)
Net income 691,160 309,496 131,894 52 1,132,602
Total assets 25,238,359 5,369,730 2,866,377 (2,391,735) 31,082,731
Investment in aliates – at equity 154,193 – 209,033 (134,137) 229,089
Cash paid for long-lived asset additions 1,306,387 302,865 23,034 982 1,633,268
2005
Operating revenues $ 8,526,943 $ 1,421,547 $ 237,735 $ (79,978) $ 10,106,247
Deprec., amort. & decomm. 867,755 117,752 13,991 – 999,498
Interest and dividend income 75,748 66,836 78,185 (70,290) 150,479
Equity in earnings of unconsolidated equity aliates 765 – 220 – 985
Interest and other charges 386,672 50,874 133,777 (70,292) 501,031
Income tax (benets) 405,662 163,865 (10,243) – 559,284
Loss from discontinued operations – – (44,794) – (44,794)
Net income (loss) 659,760 282,623 (44,019) (33) 898,331
Total assets 25,248,820 4,887,572 3,477,169 (2,755,904) 30,857,657
Investment in aliates – at equity 150,135 – 428,006 (281,357) 296,784
Cash paid for long-lived asset additions 1,285,012 160,899 11,230 945 1,458,086
Businesses marked with * are sometimes referred to as the “competitive businesses,” with the exception of the parent company, Entergy Corporation.
Eliminations are primarily intersegment activity. Almost all of Entergy’s goodwill is related to the Utility segment.
Entergy’s segment nancial information is as follows (in thousands):
Nuclear*Utility All Other*
Non-Utility