Entergy 2007 Annual Report Download - page 58
Download and view the complete annual report
Please find page 58 of the 2007 Entergy annual report below. You can navigate through the pages in the report by either clicking on the pages listed below, or by using the keyword search tool below to find specific information within the annual report.-
 1
1 -
2
-
3
-
4
-
5
-
6
-
7
-
8
-
9
-
10
-
11
-
12
-
13
-
14
-
15
-
16
-
17
-
18
-
19
-
20
-
21
-
22
-
23
-
24
-
25
-
26
-
27
-
28
-
29
-
30
-
31
-
32
-
33
-
34
-
35
-
36
-
37
-
38
-
39
-
40
-
41
-
42
-
43
-
44
-
45
-
46
-
47
-
 48
48 -
 49
49 -
 50
50 -
 51
51 -
 52
52 -
 53
53 -
 54
54 -
 55
55 -
 56
56 -
 57
57 -
 58
58 -
 59
59 -
 60
60 -
 61
61 -
 62
62 -
 63
63 -
 64
64 -
 65
65 -
 66
66 -
 67
67 -
 68
68 -
69
-
70
-
71
-
72
-
73
-
74
-
75
-
76
-
77
-
78
-
79
-
80
-
81
-
82
-
83
-
84
-
85
-
86
-
87
-
88
-
89
-
90
-
91
-
92
-
93
-
94
-
95
-
96
-
97
-
98
-
99
-
100
-
101
-
102
-
103
-
104
 |
 |

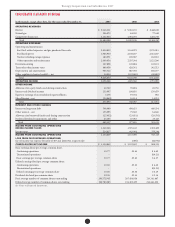
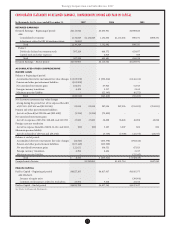
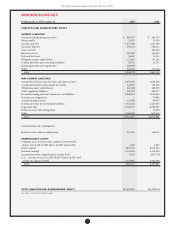
56
Entergy Corporation and Subsidiaries 2007
C O N S O L I D A T E D B A L A N C E S H E E T S
In thousands, as of December 31, 2007 2006
ASSETS
CURRENT ASSETS
Cash and cash equivalents:
Cash $ 145,925 $ 117,379
Temporary cash investments – at cost, which approximates market 1,127,076 898,773
Total cash and cash equivalents 1,273,001 1,016,152
Note receivable – Entergy New Orleans DIP loan – 51,934
Notes receivable 161 699
Accounts receivable:
Customer 610,724 552,376
Allowance for doubtful accounts (25,789) (19,348)
Other 303,060 345,400
Accrued unbilled revenues 288,076 249,165
Total accounts receivable 1,176,071 1,127,593
Accumulated deferred income taxes 38,117 11,680
Fuel inventory – at average cost 208,584 193,098
Materials and supplies – at average cost 692,376 604,998
Deferred nuclear refueling outage costs 172,936 147,521
System agreement cost equalization 268,000 –
Prepayments and other 129,001 171,759
Total 3,958,247 3,325,434
OTHER PROPERTY AND INVESTMENTS
Investment in aliates – at equity 78,992 229,089
Decommissioning trust funds 3,307,636 2,858,523
Non-utility property – at cost (less accumulated depreciation) 220,204 212,726
Other 82,563 47,115
Total 3,689,395 3,347,453
PROPERTY, PLANT AND EQUIPMENT
Electric 32,959,022 30,713,284
Property under capital lease 740,095 730,182
Natural gas 300,767 92,787
Construction work in progress 1,054,833 786,147
Nuclear fuel under capital lease 361,502 336,017
Nuclear fuel 665,620 494,759
Total property, plant and equipment 36,081,839 33,153,176
Less – accumulated depreciation and amortization 15,107,569 13,715,099
Property, plant and equipment – net 20,974,270 19,438,077
DEFERRED DEBITS AND OTHER ASSETS
Regulatory assets:
SFAS 109 regulatory asset – net 595,743 740,110
Other regulatory assets 2,971,399 2,768,352
Deferred fuel costs 168,122 168,122
Long-term receivables 7,714 19,349
Goodwill 377,172 377,172
Other 900,940 898,662
Total 5,021,090 4,971,767
TOTAL ASSETS $33,643,002 $31,082,731
S e e N o t e s t o F i n a n c i a l S t a t e m e n t s .