Entergy 2007 Annual Report Download - page 56
Download and view the complete annual report
Please find page 56 of the 2007 Entergy annual report below. You can navigate through the pages in the report by either clicking on the pages listed below, or by using the keyword search tool below to find specific information within the annual report.-
 1
1 -
2
-
3
-
4
-
5
-
6
-
7
-
8
-
9
-
10
-
11
-
12
-
13
-
14
-
15
-
16
-
17
-
18
-
19
-
20
-
21
-
22
-
23
-
24
-
25
-
26
-
27
-
28
-
29
-
30
-
31
-
32
-
33
-
34
-
35
-
36
-
37
-
38
-
39
-
40
-
41
-
42
-
43
-
44
-
45
-
 46
46 -
 47
47 -
 48
48 -
 49
49 -
 50
50 -
 51
51 -
 52
52 -
 53
53 -
 54
54 -
 55
55 -
 56
56 -
 57
57 -
 58
58 -
 59
59 -
 60
60 -
 61
61 -
 62
62 -
 63
63 -
 64
64 -
 65
65 -
 66
66 -
67
-
68
-
69
-
70
-
71
-
72
-
73
-
74
-
75
-
76
-
77
-
78
-
79
-
80
-
81
-
82
-
83
-
84
-
85
-
86
-
87
-
88
-
89
-
90
-
91
-
92
-
93
-
94
-
95
-
96
-
97
-
98
-
99
-
100
-
101
-
102
-
103
-
104
 |
 |

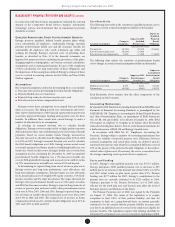
54
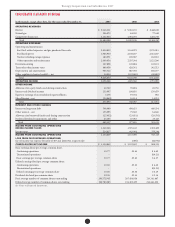
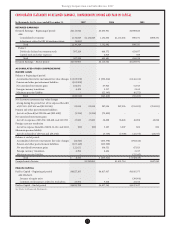
Entergy Corporation and Subsidiaries 2007
CONSOLIDATED STATEMENTS OF INCOME
In thousands, except share data, for the years ended December 31, 2007 2006 2005
OPERATING REVENUES
Electric $ 9,046,301 $ 9,063,135 $ 8,446,830
Natural gas 206,073 84,230 77,660
Competitive businesses 2,232,024 1,784,793 1,581,757
Total 11,484,398 10,932,158 10,106,247
OPERATING EXPENSES
Operating and maintenance:
Fuel, fuel-related expenses, and gas purchased for resale 2,934,833 3,144,073 2,176,015
Purchased power 1,986,950 2,138,237 2,521,247
Nuclear refueling outage expenses 180,971 169,567 162,653
Other operation and maintenance 2,649,654 2,335,364 2,122,206
Decommissioning 167,898 145,884 143,121
Taxes other than income taxes 489,058 428,561 382,521
Depreciation and amortization 963,712 887,792 856,377
Other regulatory charges (credits) – net 54,954 (122,680) (49,882)
Total 9,428,030 9,126,798 8,314,258
OPERATING INCOME 2,056,368 1,805,360 1,791,989
OTHER INCOME
Allowance for equity funds used during construction 42,742 39,894 45,736
Interest and dividend income 233,997 198,835 150,479
Equity in earnings of unconsolidated equity aliates 3,176 93,744 985
Miscellaneous – net (24,860) 16,114 14,251
Total 255,055 348,587 211,451
INTEREST AND OTHER CHARGES
Interest on long-term debt 506,089 498,451 440,334
Other interest – net 155,995 75,502 64,646
Allowance for borrowed funds used during construction (25,032) (23,931) (29,376)
Preferred dividend requirements and other 25,105 27,783 25,427
Total 662,157 577,805 501,031
INCOME FROM CONTINUING OPERATIONS
BEFORE INCOME TAXES 1,649,266 1,576,142 1,502,409
Income taxes 514,417 443,044 559,284
INCOME FROM CONTINUING OPERATIONS 1,134,849 1,133,098 943,125
LOSS FROM DISCONTINUED OPERATIONS
(net of income tax expense (benet) of $67 and ($24,051), respectively) – (496) (44,794)
CONSOLIDATED NET INCOME $ 1,134,849 $ 1,132,602 $ 898,331
Basic earnings (loss) per average common share:
Continuing operations $5.77 $5.46 $ 4.49
Discontinued operations – – $(0.21)
Basic earnings per average common share $5.77 $5.46 $ 4.27
Diluted earnings (loss) per average common share:
Continuing operations $5.60 $5.36 $ 4.40
Discontinued operations – – $(0.21)
Diluted earnings per average common share $5.60 $5.36 $ 4.19
Dividends declared per common share $2.58 $2.16 $ 2.16
Basic average number of common shares outstanding 196,572,945 207,456,838 210,141,887
Diluted average number of common shares outstanding 202,780,283 211,452,455 214,441,362
See Notes to Financial Statements.