Clearwire 2007 Annual Report Download - page 72
Download and view the complete annual report
Please find page 72 of the 2007 Clearwire annual report below. You can navigate through the pages in the report by either clicking on the pages listed below, or by using the keyword search tool below to find specific information within the annual report.-
 1
1 -
2
-
3
-
4
-
5
-
6
-
7
-
8
-
9
-
10
-
11
-
12
-
13
-
14
-
15
-
16
-
17
-
18
-
19
-
20
-
21
-
22
-
23
-
24
-
25
-
26
-
27
-
28
-
29
-
30
-
31
-
32
-
33
-
34
-
35
-
36
-
37
-
38
-
39
-
40
-
41
-
42
-
43
-
44
-
45
-
46
-
47
-
48
-
49
-
50
-
51
-
52
-
53
-
54
-
55
-
56
-
57
-
58
-
59
-
60
-
61
-
 62
62 -
 63
63 -
 64
64 -
 65
65 -
 66
66 -
 67
67 -
 68
68 -
 69
69 -
 70
70 -
 71
71 -
 72
72 -
 73
73 -
 74
74 -
 75
75 -
 76
76 -
 77
77 -
 78
78 -
 79
79 -
 80
80 -
 81
81 -
 82
82 -
83
-
84
-
85
-
86
-
87
-
88
-
89
-
90
-
91
-
92
-
93
-
94
-
95
-
96
-
97
-
98
-
99
-
100
-
101
-
102
-
103
-
104
-
105
-
106
-
107
-
108
-
109
-
110
-
111
-
112
-
113
-
114
-
115
-
116
-
117
-
118
-
119
-
120
-
121
-
122
-
123
-
124
-
125
-
126
-
127
-
128
 |
 |

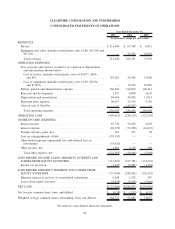
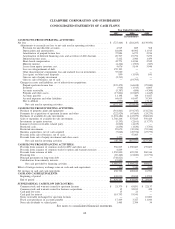
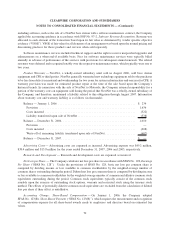
CLEARWIRE CORPORATION AND SUBSIDIARIES
CONSOLIDATED STATEMENTS OF CASH FLOWS
2007 2006 2005
Year Ended December 31,
(In thousands)
CASH FLOWS FROM OPERATING ACTIVITIES:
Net loss . . . . . . . . . . . . . . . . . . . . . . . . . . . . . . . . . . . . . . . . . . . . . . . . . . . . . . $ (727,466) $ (284,203) $(139,950)
Adjustments to reconcile net loss to net cash used in operating activities:
Provision for uncollectible accounts . . . . . . . . . . . . . . . . . . . . . . . . . . . . . . . . 4,915 885 368
Depreciation and amortization . . . . . . . . . . . . . . . . . . . . . . . . . . . . . . . . . . . . 84,694 40,902 11,913
Amortization of prepaid license fees. . . . . . . . . . . . . . . . . . . . . . . . . . . . . . . . 37,884 6,273 2,914
Amortization of deferred financing costs and accretion of debt discount . . . . . . . . 20,707 19,754 5,279
Deferred income taxes . . . . . . . . . . . . . . . . . . . . . . . . . . . . . . . . . . . . . . . . . 5,412 2,960 1,459
Share-based compensation . . . . . . . . . . . . . . . . . . . . . . . . . . . . . . . . . . . . . . 42,771 14,246 2,542
Minority interest . . . . . . . . . . . . . . . . . . . . . . . . . . . . . . . . . . . . . . . . . . . . . (4,244) (1,503) (387)
Losses from equity investees, net . . . . . . . . . . . . . . . . . . . . . . . . . . . . . . . . . . 4,676 5,144 3,946
Loss on extinguishment of debt . . . . . . . . . . . . . . . . . . . . . . . . . . . . . . . . . . . 159,193 — —
Other-than-temporary impairment loss and realized loss on investments . . . . . . . . 35,020 — —
Loss (gain) on other asset disposals . . . . . . . . . . . . . . . . . . . . . . . . . . . . . . . . 850 (1,915) 841
Gain on sale of equity investment . . . . . . . . . . . . . . . . . . . . . . . . . . . . . . . . . (2,213) — —
Gain on sale of business, net of cash . . . . . . . . . . . . . . . . . . . . . . . . . . . . . . . — (19,793) —
Changes in assets and liabilities, net of effects from acquisitions:
Prepaid spectrum license fees . . . . . . . . . . . . . . . . . . . . . . . . . . . . . . . . . . . . (235,479) (64,638) (25,040)
Inventory . . . . . . . . . . . . . . . . . . . . . . . . . . . . . . . . . . . . . . . . . . . . . . . . . . (914) (1,913) 6,005
Accounts receivable . . . . . . . . . . . . . . . . . . . . . . . . . . . . . . . . . . . . . . . . . . . (5,387) (686) (4,306)
Prepaids and other assets . . . . . . . . . . . . . . . . . . . . . . . . . . . . . . . . . . . . . . . (17,841) (10,687) (4,445)
Accounts payable . . . . . . . . . . . . . . . . . . . . . . . . . . . . . . . . . . . . . . . . . . . . 11,198 389 14,027
Accrued expenses and other liabilities . . . . . . . . . . . . . . . . . . . . . . . . . . . . . . 64,619 61,447 35,309
Due to affiliate . . . . . . . . . . . . . . . . . . . . . . . . . . . . . . . . . . . . . . . . . . . . . . (530) 184 (7,130)
Net cash used in operating activities . . . . . . . . . . . . . . . . . . . . . . . . . . . . . . (522,135) (233,154) (96,655)
CASH FLOWS FROM INVESTING ACTIVITIES:
Purchase of property, plant and equipment . . . . . . . . . . . . . . . . . . . . . . . . . . . . . (361,861) (191,747) (132,724)
Payments for acquisitions of spectrum licenses and other . . . . . . . . . . . . . . . . . . . (222,920) (67,665) (24,279)
Purchases of available-for-sale investments . . . . . . . . . . . . . . . . . . . . . . . . . . . . . (1,294,484) (1,143,079) (368,160)
Sales or maturities of available-for-sale investments . . . . . . . . . . . . . . . . . . . . . . . 1,760,246 575,845 350,429
Investments in equity investees . . . . . . . . . . . . . . . . . . . . . . . . . . . . . . . . . . . . . (5,293) (2,161) (13,737)
Issuance of notes receivable, related party. . . . . . . . . . . . . . . . . . . . . . . . . . . . . . (2,000) (4,105) —
Restricted cash . . . . . . . . . . . . . . . . . . . . . . . . . . . . . . . . . . . . . . . . . . . . . . . . (1,836) (1,830) (3,704)
Restricted investments . . . . . . . . . . . . . . . . . . . . . . . . . . . . . . . . . . . . . . . . . . . 85,670 (30,324) (55,346)
Business acquisitions, net of cash acquired . . . . . . . . . . . . . . . . . . . . . . . . . . . . . (7,066) (49,576) (27,779)
Proceeds from sale of business, net of cash. . . . . . . . . . . . . . . . . . . . . . . . . . . . . — 47,085 —
Proceeds from sale of equity investment and other assets . . . . . . . . . . . . . . . . . . . 3,250 — —
Net cash used in investing activities . . . . . . . . . . . . . . . . . . . . . . . . . . . . . . (46,294) (867,557) (275,300)
CASH FLOWS FROM FINANCING ACTIVITIES:
Proceeds from issuance of common stock for IPO and other, net . . . . . . . . . . . . . . 556,005 1,030,683 139,609
Proceeds from issuance of common stock for option and warrant exercises . . . . . . . 4,849 — —
Proceeds from issuance of debt . . . . . . . . . . . . . . . . . . . . . . . . . . . . . . . . . . . . . 1,250,000 495,350 260,346
Financing fees . . . . . . . . . . . . . . . . . . . . . . . . . . . . . . . . . . . . . . . . . . . . . . . . (69,462) (21,820) (10,774)
Principal payments on long-term debt . . . . . . . . . . . . . . . . . . . . . . . . . . . . . . . . (748,821) — —
Contributions from minority interests . . . . . . . . . . . . . . . . . . . . . . . . . . . . . . . . . 15,000 — —
Net cash provided by financing activities . . . . . . . . . . . . . . . . . . . . . . . . . . . 1,007,571 1,504,213 389,181
Effect of foreign currency exchange rates on cash and cash equivalents . . . . . . . . . . . (420) 5,340 (636)
Net increase in cash and cash equivalents . . . . . . . . . . . . . . . . . . . . . . . . . . . . . . . 438,722 408,842 16,590
CASH AND CASH EQUIVALENTS:
Beginning of period . . . . . . . . . . . . . . . . . . . . . . . . . . . . . . . . . . . . . . . . . . . . 438,030 29,188 12,598
End of period . . . . . . . . . . . . . . . . . . . . . . . . . . . . . . . . . . . . . . . . . . . . . . . . $ 876,752 $ 438,030 $ 29,188
SUPPLEMENTAL CASH FLOW DISCLOSURES:
Common stock and warrants issued for spectrum licenses . . . . . . . . . . . . . . . . . . . $ 21,379 $ 63,891 $ 22,137
Common stock and warrants issued for business acquisitions . . . . . . . . . . . . . . . . . 15 32,013 428
Cash paid for taxes . . . . . . . . . . . . . . . . . . . . . . . . . . . . . . . . . . . . . . . . . . . . . 15 21 —
Cash paid for interest . . . . . . . . . . . . . . . . . . . . . . . . . . . . . . . . . . . . . . . . . . . 119,793 53,541 —
Notes receivable exchanged for spectrum licenses . . . . . . . . . . . . . . . . . . . . . . . . — — 10,000
Fixed asset purchases in accounts payable . . . . . . . . . . . . . . . . . . . . . . . . . . . . . 17,449 3,327 11,044
Non-cash dividends to related party . . . . . . . . . . . . . . . . . . . . . . . . . . . . . . . . . . 1,465 2,384 34
See notes to consolidated financial statements.
64