Clearwire 2007 Annual Report Download - page 71
Download and view the complete annual report
Please find page 71 of the 2007 Clearwire annual report below. You can navigate through the pages in the report by either clicking on the pages listed below, or by using the keyword search tool below to find specific information within the annual report.-
 1
1 -
2
-
3
-
4
-
5
-
6
-
7
-
8
-
9
-
10
-
11
-
12
-
13
-
14
-
15
-
16
-
17
-
18
-
19
-
20
-
21
-
22
-
23
-
24
-
25
-
26
-
27
-
28
-
29
-
30
-
31
-
32
-
33
-
34
-
35
-
36
-
37
-
38
-
39
-
40
-
41
-
42
-
43
-
44
-
45
-
46
-
47
-
48
-
49
-
50
-
51
-
52
-
53
-
54
-
55
-
56
-
57
-
58
-
59
-
60
-
 61
61 -
 62
62 -
 63
63 -
 64
64 -
 65
65 -
 66
66 -
 67
67 -
 68
68 -
 69
69 -
 70
70 -
 71
71 -
 72
72 -
 73
73 -
 74
74 -
 75
75 -
 76
76 -
 77
77 -
 78
78 -
 79
79 -
 80
80 -
 81
81 -
82
-
83
-
84
-
85
-
86
-
87
-
88
-
89
-
90
-
91
-
92
-
93
-
94
-
95
-
96
-
97
-
98
-
99
-
100
-
101
-
102
-
103
-
104
-
105
-
106
-
107
-
108
-
109
-
110
-
111
-
112
-
113
-
114
-
115
-
116
-
117
-
118
-
119
-
120
-
121
-
122
-
123
-
124
-
125
-
126
-
127
-
128
 |
 |

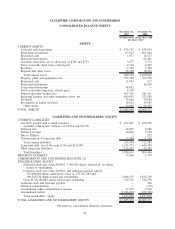
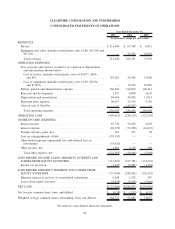
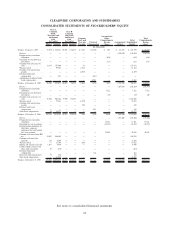
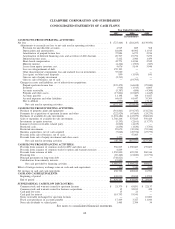
CLEARWIRE CORPORATION AND SUBSIDIARIES
CONSOLIDATED STATEMENTS OF STOCKHOLDERS’ EQUITY
Shares Amounts Shares Amounts
Common
Stock and
Warrants
Payable
Deferred
Compensation
Accumulated
Other
Comprehensive
Income
(Loss)
Accumulated
Deficit
Total
Stockholders’
Equity
Total
Comprehensive
Income
(Loss)
Class A
Common
Stock,
Warrants and
Additional
Paid
In Capital
Class B
Common
Stock and
Additional
Paid
In Capital
(In thousands)
Balances at January 1, 2005 . . . . . 43,053 $ 218,411 18,691 $ 56,073 $ 3,354 $(2,320) $ 265 $ (34,413) $ 241,370 $ (32,777)
Net loss. . . . . . . . . . . . . . . — — — — — — — (139,950) (139,950) (139,950)
Foreign currency translation
adjustment . . . . . . . . . . . . — — — — — — (636) — (636) (636)
Unrealized loss on short-term
investments . . . . . . . . . . . — — — — — — (111) — (111) (111)
Common stock issued, net of
costs . . . . . . . . . . . . . . . 13,133 157,600 — — 78 — — — 157,678
Warrants issued . . . . . . . . . . — 59,563 — — 2,541 — — — 62,104
Common stock and warrants
payable . . . . . . . . . . . . . — — — — (4,305) — — — (4,305)
Deferred stock-based
compensation . . . . . . . . . . — 881 — — — (881) — — —
Amortization of deferred stock-
based compensation . . . . . . . — — — — — 2,542 — — 2,542
Balances at December 31, 2005 . . . 56,186 436,455 18,691 56,073 1,668 (659) (482) (174,363) 318,692 (140,697)
Net loss. . . . . . . . . . . . . . . — — — — — — — (284,203) (284,203) (284,203)
Foreign currency translation
adjustment . . . . . . . . . . . . — — — — — — 7,522 — 7,522 7,522
Unrealized loss on short-term
investments . . . . . . . . . . . — — — — — — (50) — (50) (50)
Common stock issued, net of
costs . . . . . . . . . . . . . . . 53,056 946,766 9,906 178,303 — — — — 1,125,069
Warrants issued . . . . . . . . . . — 77,261 — — (1,851) — — — 75,410
Common stock and warrants
payable . . . . . . . . . . . . . — — — — 349 — — — 349
Deferred stock-based
compensation . . . . . . . . . . — — — — — 543 — — 543
Stock-based compensation . . . . . 83 14,277 — — — — — — 14,277
Balances at December 31, 2006 . . . 109,325 1,474,759 28,597 234,376 166 (116) 6,990 (458,566) 1,257,609 (276,731)
Net loss. . . . . . . . . . . . . . . — — — — — — — (727,466) (727,466) (727,466)
Foreign currency translation
adjustment . . . . . . . . . . . . — — — — — — 17,561 — 17,561 17,561
Unrealized loss on investments . . — — — — — — (42,238) — (42,238) (42,238)
Reclassification adjustment for
other-than- temporary
impairment loss and realized
loss on investments . . . . . . . — — — — — — 35,020 — 35,020 35,020
Common stock issued from IPO,
net . . . . . . . . . . . . . . . . 24,000 556,005 — — — — — 556,005
Common stock issued for
spectrum . . . . . . . . . . . . . 233 4,200 — — — — — — 4,200
Warrants issued . . . . . . . . . . — 17,194 — — (166) — — — 17,028
Options and warrants exercised . . 1,937 4,849 — — — — — — 4,849
Cashless option exercises and
other stock transactions . . . . . 39 (618) — — — — — — (618)
Deferred stock-based
compensation . . . . . . . . . . — — — — 116 — — 116
Restricted stock compensation . . 33 286 286
Share-based compensation . . . . . — 41,480 — — — — — 41,480
Balances at December 31, 2007 . . . 135,567 $2,098,155 28,597 $234,376 $ — $ — $ 17,333 $(1,186,032) $1,163,832 $(717,123)
See notes to consolidated financial statements.
63