Clearwire 2007 Annual Report Download - page 45
Download and view the complete annual report
Please find page 45 of the 2007 Clearwire annual report below. You can navigate through the pages in the report by either clicking on the pages listed below, or by using the keyword search tool below to find specific information within the annual report.-
 1
1 -
2
-
3
-
4
-
5
-
6
-
7
-
8
-
9
-
10
-
11
-
12
-
13
-
14
-
15
-
16
-
17
-
18
-
19
-
20
-
21
-
22
-
23
-
24
-
25
-
26
-
27
-
28
-
29
-
30
-
31
-
32
-
33
-
34
-
 35
35 -
 36
36 -
 37
37 -
 38
38 -
 39
39 -
 40
40 -
 41
41 -
 42
42 -
 43
43 -
 44
44 -
 45
45 -
 46
46 -
 47
47 -
 48
48 -
 49
49 -
 50
50 -
 51
51 -
 52
52 -
 53
53 -
 54
54 -
 55
55 -
56
-
57
-
58
-
59
-
60
-
61
-
62
-
63
-
64
-
65
-
66
-
67
-
68
-
69
-
70
-
71
-
72
-
73
-
74
-
75
-
76
-
77
-
78
-
79
-
80
-
81
-
82
-
83
-
84
-
85
-
86
-
87
-
88
-
89
-
90
-
91
-
92
-
93
-
94
-
95
-
96
-
97
-
98
-
99
-
100
-
101
-
102
-
103
-
104
-
105
-
106
-
107
-
108
-
109
-
110
-
111
-
112
-
113
-
114
-
115
-
116
-
117
-
118
-
119
-
120
-
121
-
122
-
123
-
124
-
125
-
126
-
127
-
128
 |
 |

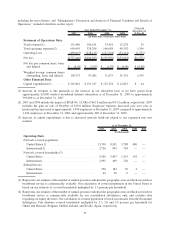
including the notes thereto, and “Management’s Discussion and Analysis of Financial Condition and Results of
Operations,” included elsewhere in this report.
2007 2006 2005 2004
27-Oct-03
(Inception) to
31-Dec-03
Year Ended December 31,
(In thousands, except per share data)
Statement of Operations Data:
Total revenues(1) ............. 151,440 100,181 33,454 15,278 25
Total operating expenses(2) ..... 650,455 338,296 160,688 48,392 1,396
Operating Loss .............. (499,015) (238,115) (127,234) (33,114) (1,371)
Net loss ................... $(727,466) $(284,203) $(139,950) $(33,042) $(1,371)
Net loss per common share, basic
and diluted ............... $ (4.58) $ (2.93) $ (1.97) $ (0.90) $ (0.88)
Weighted average common shares
outstanding, basic and diluted. . 158,737 97,085 71,075 36,791 1,555
Other Financial Data:
Capital expenditures(3) ........ $361,861 $ 191,747 $ 132,724 $ 12,815 $ 64
(1) Increase in revenues is due primarily to the increase in our subscriber base as we have grown from
approximately 62,000 wireless broadband Internet subscribers as of December 31, 2005 to approximately
394,000 as of December 31, 2007.
(2) 2007 and 2006 include the impact of SFAS No. 123(R) of $42.8 million and $14.2 million, respectively. 2007
includes the gain on sale of NextNet of $19.8 million. Employee expenses increased year over year as
headcount has increased to approximately 1,990 employees at December 31, 2007 compared to approximately
1,240 employees at December 31, 2006 and approximately 620 at December 31, 2005.
(3) Increase in capital expenditures is due to increased network build-out related to our expansion into new
markets.
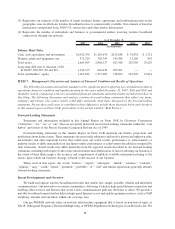
2007 2006 2005 2004 2003
As of December 31,
(In thousands)
Operating Data:
Network covered population:
United States(1) .............................. 13,550 8,551 3,788 480 —
International(2) ............................... 2,726 995 765 — —
Network covered households:(3)
United States ................................ 5,420 3,447 1,515 192 —
International ................................. 1,095 409 326 — —
Subscribers:(4)
United States ................................ 350 184 56 4 —
International ................................. 44 22 6 — —
(1) Represents our estimate of the number of natural persons resident in the geographic areas in which our wireless
broadband service is commercially available. Our calculation of covered population in the United States is
based on our estimate of covered households multiplied by 2.5 persons per household.
(2) Represents our estimate of the number of natural persons resident in the geographic areas in which our wireless
broadband service is commercially available for our consolidated subsidiaries only, and excludes data
regarding our equity investees. Our calculation of covered population is based on estimates from the Economist
Intelligence Unit database covered households multiplied by 2.3, 3.0 and 2.9 persons per household for
Ghent and Brussels, Belgium, Dublin, Ireland, and Seville, Spain, respectively.
37