Clearwire 2007 Annual Report Download - page 60
Download and view the complete annual report
Please find page 60 of the 2007 Clearwire annual report below. You can navigate through the pages in the report by either clicking on the pages listed below, or by using the keyword search tool below to find specific information within the annual report.substantive changes in the financial condition and performance of the investments’ issuers and other substantive
changes in these investments.
The stated maturity of these securities is longer than 10 years; however, because we considered them to be
highly liquid and available for operations, our convention was to use the next auction date, which occurs every 30 to
90 days, as the effective maturity date and these securities were recorded as short-term investments. Current market
conditions do not allow the Company to estimate when the auctions for its auction rate securities will resume. As a
result, during 2007 the Company reclassified its auction rate securities from short-term investments to long-term
investments.
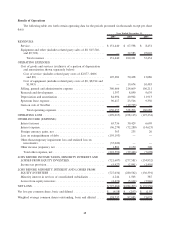
Other income (expense), net. In the year ended December 31, 2007 we had approximately $1.8 million in
other income compared to approximately $2.2 million in other expenses in the year ended December 31, 2006.
Income tax provision. We incurred $5.4 million of income tax expense in 2007 as compared to $3.0 million in
2006. The expense represents the recognition of a deferred tax liability related to the accounting for FCC licenses
we own. Owned FCC licenses are amortized over 15 years for U.S. tax purposes but, since these licenses have an
indefinite life under accounting principals generally accepted in the United States, they are not amortized for
financial statement reporting purposes. This ongoing difference between the financial statements and tax amor-
tization treatment resulted in our deferred income tax expense.
Losses from equity investees. During the year ended December 31, 2007, we had approximately $4.7 million
in losses from equity investees compared to approximately $5.1 million in losses in year ended December 31, 2006.
This decrease was primarily due to the growth in the aggregate subscriber base offset by the increasing overhead
costs to grow the businesses and the impact of a weakening U.S. dollar.
Minority interest in net loss of consolidated subsidiaries. During the year ended December 31, 2007, we
allocated approximately $4.2 million in losses on our consolidated subsidiaries to minority interests, compared to
approximately $1.5 million in losses allocated to minority interests in the year ended December 31, 2006. This
increase in amount of losses assigned to minority interests was primarily due to the addition of a minority partner for
our Hawaii operations.
Year Ended December 31, 2006 Compared to Year Ended December 31, 2005
Revenue. Total revenues increased $66.7 million to $100.2 million in 2006 from $33.5 million in 2005. This
result includes a $59.1 million increase in service revenue as we increased our subscriber base, as well as a
$7.6 million increase in equipment revenue derived from NextNet operations. U.S. revenue represented approx-
imately 83.3% of total revenue and international represented approximately 16.7% of total revenue in 2006
compared to approximately 95.7% and approximately 4.3% in 2005, respectively.
Service revenue. As of December 31, 2006, we operated in 34 U.S. markets and two international markets
covering a geographic area containing approximately 9.6 million people. Total subscribers in all markets grew from
approximately 62,300 as of December 31, 2005 to approximately 206,200 as of December 31, 2006, generating
service revenue of approximately $67.6 million in 2006 as compared to $8.5 million in 2005. This $59.1 million
increase reflects net increases of 84,800 subscribers in markets launched prior to January 1, 2006, and 59,100
subscribers in the nine markets launched during 2006. Of these nine new markets, seven were launched in the
second half of 2006.
Equipment and other revenue. Our equipment and other revenue includes sales of NextNet equipment
through the date of sale in August 2006. Equipment and other revenue increased approximately $7.6 million, to
$32.6 million for the eight-month period ending on the date of sale from $25.0 million for the full year of 2005. This
increase is primarily due to an increase in the volume of sales of CPE and other units to Inukshuk, Inc., a joint
venture between Rogers Cable Enterprises and Bell Canada, through an arrangement with Flux Fixed Wireless,
LLC, an entity controlled by Mr. McCaw. Total related party sales increased $5.8 million to $15.5 million in 2006
from $9.7 million in 2005. The remainder of the increase is a result of an increase in overall sales volume across our
customer base.
52


