Clearwire 2007 Annual Report Download - page 44
Download and view the complete annual report
Please find page 44 of the 2007 Clearwire annual report below. You can navigate through the pages in the report by either clicking on the pages listed below, or by using the keyword search tool below to find specific information within the annual report.-
 1
1 -
2
-
3
-
4
-
5
-
6
-
7
-
8
-
9
-
10
-
11
-
12
-
13
-
14
-
15
-
16
-
17
-
18
-
19
-
20
-
21
-
22
-
23
-
24
-
25
-
26
-
27
-
28
-
29
-
30
-
31
-
32
-
33
-
 34
34 -
 35
35 -
 36
36 -
 37
37 -
 38
38 -
 39
39 -
 40
40 -
 41
41 -
 42
42 -
 43
43 -
 44
44 -
 45
45 -
 46
46 -
 47
47 -
 48
48 -
 49
49 -
 50
50 -
 51
51 -
 52
52 -
 53
53 -
 54
54 -
55
-
56
-
57
-
58
-
59
-
60
-
61
-
62
-
63
-
64
-
65
-
66
-
67
-
68
-
69
-
70
-
71
-
72
-
73
-
74
-
75
-
76
-
77
-
78
-
79
-
80
-
81
-
82
-
83
-
84
-
85
-
86
-
87
-
88
-
89
-
90
-
91
-
92
-
93
-
94
-
95
-
96
-
97
-
98
-
99
-
100
-
101
-
102
-
103
-
104
-
105
-
106
-
107
-
108
-
109
-
110
-
111
-
112
-
113
-
114
-
115
-
116
-
117
-
118
-
119
-
120
-
121
-
122
-
123
-
124
-
125
-
126
-
127
-
128
 |
 |
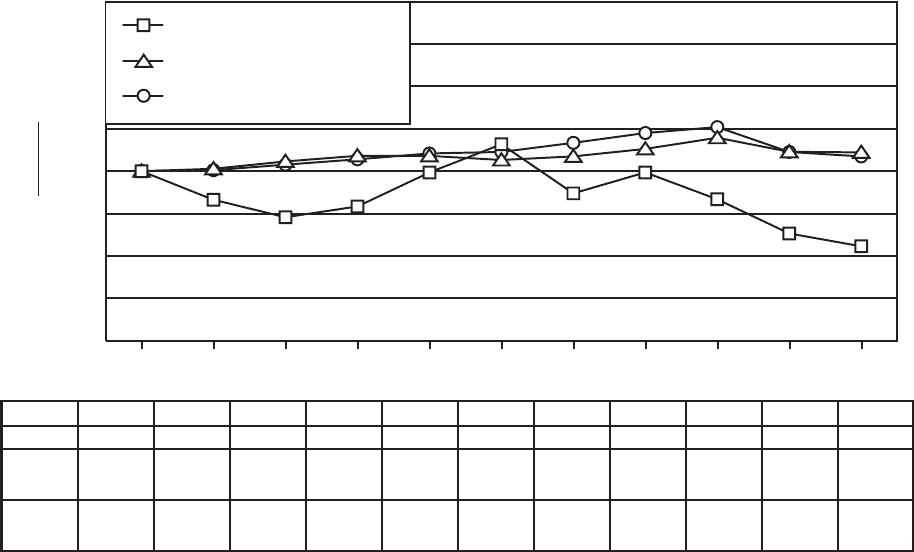
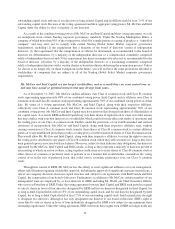
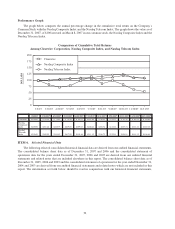
Performance Graph
The graph below compares the annual percentage change in the cumulative total return on the Company’s
Common Stock with the Nasdaq Composite Index and the Nasdaq Telecom Index. The graph shows the value as of
December 31, 2007, of $100 invested on March 8, 2007 in our common stock, the Nasdaq Composite Index and the
Nasdaq Telecom Index.
Comparison of Cumulative Total Returns
Among Clearwire Corporation, Nasdaq Composite Index, and Nasdaq Telecom Index
0
25
50
75
100
125
150
175
200
12/31/0711/30/0710/31/079/28/078/31/077/31/076/29/075/31/074/30/073/30/073/8/07
DOLLARS
Clearwire
Nasdaq Composite Index
Nasdaq Telecom Index
3/8/2007 3/30/2007 4/30/2007 5/31/2007 6/29/2007 7/31/2007 8/31/2007 9/28/2007 10/31/2007 11/30/2007 12/31/2007
Clearwire $100.00 $ 83.14 $ 72.83 $ 79.20 $ 99.23 $115.88 $ 86.92 $ 99.27 $ 83.39 $ 63.24 $ 55.69
Nasdaq
Composite
Index $100.00 $101.42 $105.75 $109.08 $109.03 $106.61 $108.74 $113.14 $119.74 $111.44 $111.08
Nasdaq
Telecom
Index $100.00 $100.59 $103.85 $107.00 $110.46 $111.35 $116.72 $122.51 $126.01 $111.35 $108.68
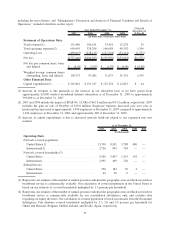
ITEM 6. Selected Financial Data
The following selected consolidated historical financial data are derived from our audited financial statements.
The consolidated balance sheet data as of December 31, 2007 and 2006 and the consolidated statement of
operations data for the years ended December 31, 2007, 2006 and 2005 are derived from our audited financial
statements and related notes that are included elsewhere in this report. The consolidated balance sheet data as of
December 31, 2005, 2004 and 2003 and the consolidated statement of operations for the year ended December 31,
2004 and 2003 are derived from our audited financial statements and related notes which are not included in this
report. The information set forth below should be read in conjunction with our historical financial statements,
36