Clearwire 2007 Annual Report Download - page 61
Download and view the complete annual report
Please find page 61 of the 2007 Clearwire annual report below. You can navigate through the pages in the report by either clicking on the pages listed below, or by using the keyword search tool below to find specific information within the annual report.-
 1
1 -
2
-
3
-
4
-
5
-
6
-
7
-
8
-
9
-
10
-
11
-
12
-
13
-
14
-
15
-
16
-
17
-
18
-
19
-
20
-
21
-
22
-
23
-
24
-
25
-
26
-
27
-
28
-
29
-
30
-
31
-
32
-
33
-
34
-
35
-
36
-
37
-
38
-
39
-
40
-
41
-
42
-
43
-
44
-
45
-
46
-
47
-
48
-
49
-
50
-
 51
51 -
 52
52 -
 53
53 -
 54
54 -
 55
55 -
 56
56 -
 57
57 -
 58
58 -
 59
59 -
 60
60 -
 61
61 -
 62
62 -
 63
63 -
 64
64 -
 65
65 -
 66
66 -
 67
67 -
 68
68 -
 69
69 -
 70
70 -
 71
71 -
72
-
73
-
74
-
75
-
76
-
77
-
78
-
79
-
80
-
81
-
82
-
83
-
84
-
85
-
86
-
87
-
88
-
89
-
90
-
91
-
92
-
93
-
94
-
95
-
96
-
97
-
98
-
99
-
100
-
101
-
102
-
103
-
104
-
105
-
106
-
107
-
108
-
109
-
110
-
111
-
112
-
113
-
114
-
115
-
116
-
117
-
118
-
119
-
120
-
121
-
122
-
123
-
124
-
125
-
126
-
127
-
128
 |
 |
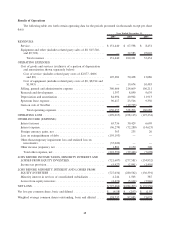
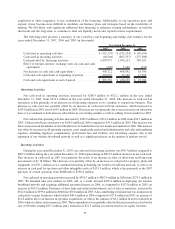
Cost of goods and services. Total cost of goods and services increased $46.5 million to $70.1 million in 2006,
from $23.6 million in 2005. U.S. cost of goods and services represented approximately 87.2% and international
represented approximately 12.8% of total cost of goods and services in 2006 compared to approximately 94.0% and
approximately 6.0% in 2005, respectively.
Cost of service. As a result of the expansion in 2006 of our wireless broadband network and related
subscriber growth, cost of service increased to $50.4 million in 2006 as compared to $13.1 million in 2005. The
increase is due to an increase in costs for towers leased and related back haul costs, the number of subscribers using
our service, and additional markets served. As a percentage of service revenue, cost of service decreased to 74.6% in
2006 from 154.8% in 2005, primarily as a result of the revenue generated from our increased subscriber base.
Cost of equipment. Our cost of equipment consists of costs incurred for equipment manufactured by NextNet
through August 29, 2006. Following the increase in the number of CPE units sold in 2006, cost of equipment
increased $9.2 million to $19.7 million for the eight months we owned NextNet in 2006, as compared to
$10.5 million in 2005. As a percentage of equipment and other revenue, cost of equipment increased to 60.4%
in 2006 from 41.9% in 2005, as a result of a full year of sales in 2005 to Flux Fixed Wireless, a related party, which
had higher overall margins, as compared to eight months in 2006, due to the sale of NextNet. As a result of our sale
of NextNet, we do not currently expect to incur any future material cost of equipment.
Selling, general and administrative expense. Selling, general and administrative expense increased
$108.5 million, or 102.1%, to $214.7 million in 2006 from $106.2 million in 2005. The overall increase is due
primarily to employee compensation and related costs, including facilities costs due to higher employee headcount,
additional marketing and advertising expenses related to the expansion of our business, increases in third party
commission expenses; and higher professional fee expenses. Employee and related compensation expense
increased $63.4 million due to headcount increases to support the overall growth of our business. Our total
employee headcount increased from approximately 622 at December 31, 2005 to approximately 1,240 at
December 31, 2006. Marketing and advertising expense increased $20.5 million as we expanded our number
of markets from 27 to 36 and increased our subscriber base from 62,300 at December 31, 2005 to 206,200 at
December 31, 2006. Facilities expenses increased $6.2 million in connection with the headcount increase and
market expansion. Third party commission expenses increased $5.5 million as we sold more services through third
party providers. Professional fees, which include legal, accounting and other costs related to regulatory compliance,
increased $5.3 million to $20.9 million in 2006 from $15.6 million in 2005 resulting primarily from costs associated
with our prior withdrawn registration statement and general growth in our legal, accounting and regulatory needs
caused by our growth. Other costs increased $7.5 million and included expenses related to our new call center.
Research and development expense. Research and development expense decreased $749,000, or 7.8%, to
$8.9 million in 2006 from $9.6 million in 2005. The decrease was due primarily from the sale of NextNet in August
2006.
Depreciation and amortization expense. Depreciation and amortization expense increased $29.0 million to
$40.9 million in 2006 from $11.9 million in 2005, primarily due to increased network build-out and deployed CPE
costs related to our expansion into new markets and associated subscriber growth. Capital expenditures for
depreciable property, plant and equipment increased $59.0 million to $191.7 million in 2006 from $132.7 million in
2005. The majority of these expenditures relate to the construction of our network and purchases of base station
equipment.
Changes in technology customarily used in our business, such as a transition to mobile WiMAX, may result in
an impairment in the value or a change in the estimated useful life of our pre-WiMAX network equipment already
placed in service. If such a change occurs, we may be required to record an impairment charge to reduce the carrying
amount of equipment in service to its fair value, and to accelerate the useful life of the respective equipment,
resulting in an increase in periodic depreciation expense over the remaining useful life of the equipment, or, in
appropriate instances, to write off the entire unamortized value.
53