Cigna 2011 Annual Report Download - page 93
Download and view the complete annual report
Please find page 93 of the 2011 Cigna annual report below. You can navigate through the pages in the report by either clicking on the pages listed below, or by using the keyword search tool below to find specific information within the annual report.-
 1
1 -
2
-
3
-
4
-
5
-
6
-
7
-
8
-
9
-
10
-
11
-
12
-
13
-
14
-
15
-
16
-
17
-
18
-
19
-
20
-
21
-
22
-
23
-
24
-
25
-
26
-
27
-
28
-
29
-
30
-
31
-
32
-
33
-
34
-
35
-
36
-
37
-
38
-
39
-
40
-
41
-
42
-
43
-
44
-
45
-
46
-
47
-
48
-
49
-
50
-
51
-
52
-
53
-
54
-
55
-
56
-
57
-
58
-
59
-
60
-
61
-
62
-
63
-
64
-
65
-
66
-
67
-
68
-
69
-
70
-
71
-
72
-
73
-
74
-
75
-
76
-
77
-
78
-
79
-
80
-
81
-
82
-
 83
83 -
 84
84 -
 85
85 -
 86
86 -
 87
87 -
 88
88 -
 89
89 -
 90
90 -
 91
91 -
 92
92 -
 93
93 -
 94
94 -
 95
95 -
 96
96 -
 97
97 -
 98
98 -
 99
99 -
 100
100 -
 101
101 -
 102
102 -
 103
103 -
104
-
105
-
106
-
107
-
108
-
109
-
110
-
111
-
112
-
113
-
114
-
115
-
116
-
117
-
118
-
119
-
120
-
121
-
122
-
123
-
124
-
125
-
126
-
127
-
128
-
129
-
130
-
131
-
132
-
133
-
134
-
135
-
136
-
137
-
138
-
139
-
140
-
141
-
142
-
143
-
144
-
145
-
146
-
147
-
148
-
149
-
150
-
151
-
152
-
153
-
154
-
155
-
156
-
157
-
158
-
159
-
160
-
161
-
162
-
163
-
164
-
165
-
166
-
167
-
168
-
169
-
170
-
171
-
172
-
173
-
174
-
175
-
176
-
177
-
178
-
179
-
180
 |
 |
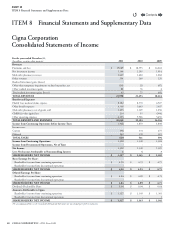
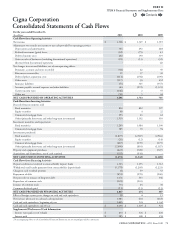
71CIGNA CORPORATION2011 Form10K
PART II
ITEM 8 Financial Statements and Supplementary Data
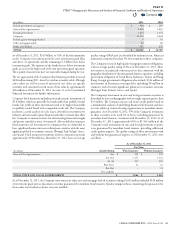
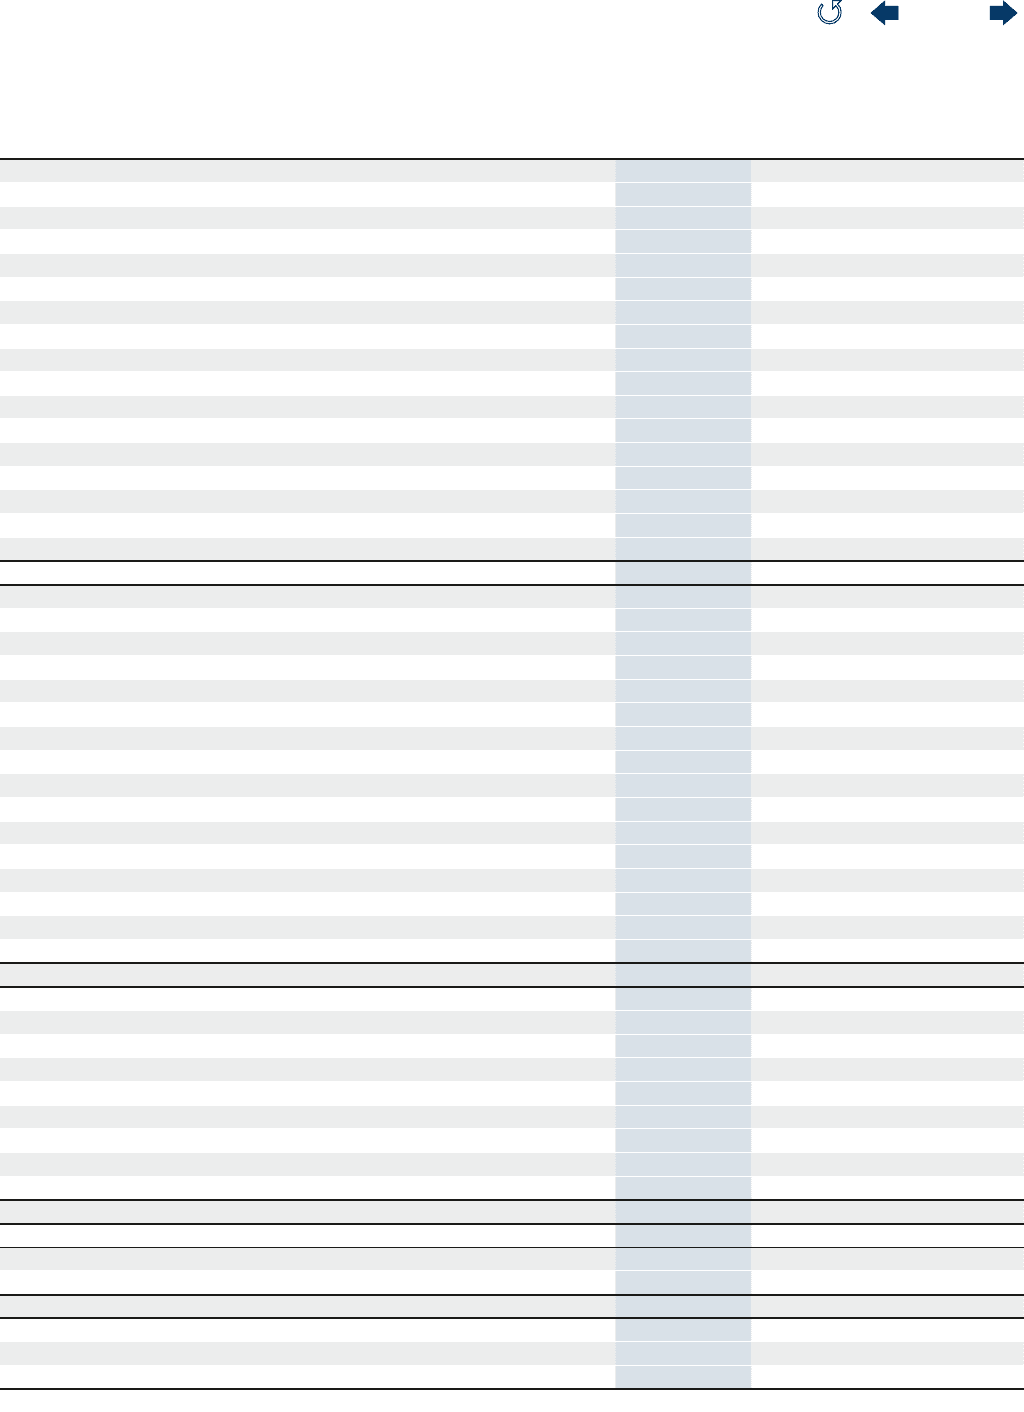
Cigna Corporation
Consolidated Statements of Cash Flows
For the years ended December31,
(In millions)
2011 2010 2009
Cash Flows from Operating Activities
Net income $ 1,328 $ 1,349 $ 1,305
Adjustments to reconcile net income to net cash provided by operating activities:
Depreciation and amortization 345 292 268
Realized investment (gains) losses (62) (75) 43
Deferred income taxes 242 190 319
Gains on sales of businesses (excluding discontinued operations) (25) (13) (32)
(Income) from discontinued operations - - (1)
Net changes in assets and liabilities, net of non-operating eects:
Premiums, accounts and notes receivable (50) 62 49
Reinsurance recoverables 19 37 30
Deferred policy acquisition costs (211) (156) (109)
Other assets (317) (3) 452
Insurance liabilities 154 325 (357)
Accounts payable, accrued expenses and other liabilities 344 (272) (1,321)
Current income taxes (246) 2 55
Other, net (30) 5 44
NET CASH PROVIDED BY OPERATING ACTIVITIES 1,491 1,743 745
Cash Flows from Investing Activities
Proceeds from investments sold:
Fixed maturities 830 822 927
Equity securities 46 4 22
Commercial mortgage loans 253 63 61
Other (primarily short-term and other long-term investments) 1,915 1,102 910
Investment maturities and repayments:
Fixed maturities 1,265 1,084 1,100
Commercial mortgage loans 385 70 94
Investments purchased:
Fixed maturities (2,877) (2,587) (2,916)
Equity securities (20) (12) (14)
Commercial mortgage loans (487) (239) (175)
Other (primarily short-term and other long-term investments) (2,056) (810) (1,187)
Property and equipment purchases (422) (300) (307)
Acquisitions and dispositions, net of cash acquired (102) (539) -
NET CASH USED IN INVESTING ACTIVITIES (1,270) (1,342) (1,485)
Cash Flows from Financing Activities
Deposits and interest credited to contractholder deposit funds 1,323 1,295 1,312
Withdrawals and benet payments from contractholder deposit funds (1,178) (1,205) (1,223)
Change in cash overdraft position (1) 59 53
Repayment of debt (451) (270) (200)
Net proceeds on issuance of long-term debt 2,676 543 346
Repurchase of common stock (225) (201) -
Issuance of common stock 734 64 30
Common dividends paid (11) (11) (11)
NET CASH PROVIDED BY FINANCING ACTIVITIES 2,867 274 307
Eect of foreign currency rate changes on cash and cash equivalents (3) 6 15
Net increase (decrease) in cash and cash equivalents 3,085 681 (418)
Cash and cash equivalents, beginning of year 1,605 924 1,342
Cash and cash equivalents, end of year $ 4,690 $ 1,605 $ 924
Supplemental Disclosure of Cash Information:
Income taxes paid, net of refunds $ 633 $ 326 $ 220
Interest paid $ 185 $ 180 $ 158
The accompanying Notes to the Consolidated Financial Statements are an integral part of these statements.
Contents
Q