Cigna 2011 Annual Report Download - page 123
Download and view the complete annual report
Please find page 123 of the 2011 Cigna annual report below. You can navigate through the pages in the report by either clicking on the pages listed below, or by using the keyword search tool below to find specific information within the annual report.-
 1
1 -
2
-
3
-
4
-
5
-
6
-
7
-
8
-
9
-
10
-
11
-
12
-
13
-
14
-
15
-
16
-
17
-
18
-
19
-
20
-
21
-
22
-
23
-
24
-
25
-
26
-
27
-
28
-
29
-
30
-
31
-
32
-
33
-
34
-
35
-
36
-
37
-
38
-
39
-
40
-
41
-
42
-
43
-
44
-
45
-
46
-
47
-
48
-
49
-
50
-
51
-
52
-
53
-
54
-
55
-
56
-
57
-
58
-
59
-
60
-
61
-
62
-
63
-
64
-
65
-
66
-
67
-
68
-
69
-
70
-
71
-
72
-
73
-
74
-
75
-
76
-
77
-
78
-
79
-
80
-
81
-
82
-
83
-
84
-
85
-
86
-
87
-
88
-
89
-
90
-
91
-
92
-
93
-
94
-
95
-
96
-
97
-
98
-
99
-
100
-
101
-
102
-
103
-
104
-
105
-
106
-
107
-
108
-
109
-
110
-
111
-
112
-
 113
113 -
 114
114 -
 115
115 -
 116
116 -
 117
117 -
 118
118 -
 119
119 -
 120
120 -
 121
121 -
 122
122 -
 123
123 -
 124
124 -
 125
125 -
 126
126 -
 127
127 -
 128
128 -
 129
129 -
 130
130 -
 131
131 -
 132
132 -
 133
133 -
134
-
135
-
136
-
137
-
138
-
139
-
140
-
141
-
142
-
143
-
144
-
145
-
146
-
147
-
148
-
149
-
150
-
151
-
152
-
153
-
154
-
155
-
156
-
157
-
158
-
159
-
160
-
161
-
162
-
163
-
164
-
165
-
166
-
167
-
168
-
169
-
170
-
171
-
172
-
173
-
174
-
175
-
176
-
177
-
178
-
179
-
180
 |
 |

101CIGNA CORPORATION2011 Form10K
PART II
ITEM 8 Financial Statements and Supplementary Data
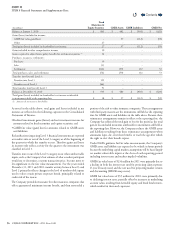
At December31,2011, scheduled commercial mortgage loan maturities
were as follows (inmillions): $529 in 2012, $525 in 2013, $329 in
2014, $372 in 2015 and $1,546 thereafter. Actual maturities could dier
from contractual maturities for several reasons: borrowers may have the
right to prepay obligations, with or without prepayment penalties; the
maturity date may be extended; and loans may be renanced.
As of December31,2011, the Company had commitments to extend
credit under commercial mortgage loan agreements of $162million
that were diversied by property type and geographic region.
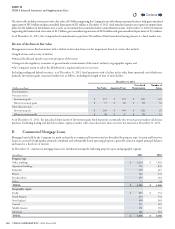
Credit quality
e Company applies a consistent and disciplined approach to evaluating
and monitoring credit risk, beginning with the initial underwriting of a
mortgage loan and continuing throughout the investment holding period.
Mortgage origination professionals employ an internal rating system
developed from the Company’s experience in real estate investing and
mortgage lending. A quality rating, designed to evaluate the relative risk
of the transaction, is assigned at each loan’s origination and is updated
each year as part of the annual portfolio loan review. e Company
monitors credit quality on an ongoing basis, classifying each loan as
a loan in good standing, potential problem loan or problem loan.
Quality ratings are based on internal evaluations of each loan’s specic
characteristics considering a number of key inputs, including real
estate market-related factors such as rental rates and vacancies, and
property-specic inputs such as growth rate assumptions and lease
rollover statistics. However, the two most signicant contributors to
the credit quality rating are the debt service coverage and loan-to-value
ratios. e debt service coverage ratio measures the amount of property
cash ow available to meet annual interest and principal payments on
debt. A debt service coverage ratio below 1.0 indicates that there is not
enough cash ow to cover the loan payments. e loan-to-value ratio,
commonly expressed as a percentage, compares the amount of the loan
to the fair value of the underlying property collateralizing the loan.
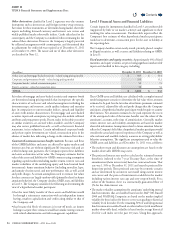
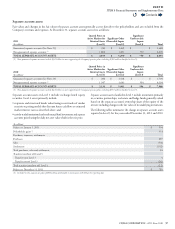
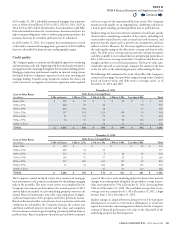
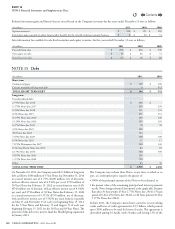
e following tables summarize the credit risk prole of the Company’s
commercial mortgage loan portfolio using carrying values classied
based on loan-to-value and debt service coverage ratios, as of
December31,2011 and 2010:
Loan-to-Value Ratios
(In millions)
December31,2011
Debt Service Coverage Ratio
Total1.30x or Greater 1.20x to 1.29x 1.10x to 1.19x 1.00x to 1.09x Less than 1.00x
Below 50% $ 225 $ 55 $ 3 $ 50 $ 9 $ 342
50% to 59% 444 47 26 - 53 570
60% to 69% 646 140 42 - 77 905
70% to 79% 117 132 120 159 33 561
80% to 89% 99 81 79 72 71 402
90% to 99% 36 35 30 58 116 275
100% or above - 10 50 51 135 246
TOTAL $ 1,567 $ 500 $ 350 $ 390 $ 494 $ 3,301
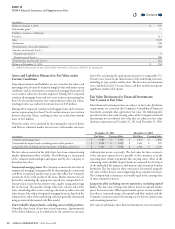
Loan-to-Value Ratios
(In millions)
December31,2010
Debt Service Coverage Ratio
Total1.30x or Greater 1.20x to 1.29x 1.10x to 1.19x 1.00x to 1.09x Less than 1.00x
Below 50% $ 324 $ - $ - $ - $ 29 $ 353
50% to 59% 409 54 56 - - 519
60% to 69% 533 73 5 28 25 664
70% to 79% 138 79 57 55 11 340
80% to 89% 267 186 165 151 69 838
90% to 99% 15 54 181 185 135 570
100% or above - - 47 43 112 202
TOTAL $ 1,686 $ 446 $ 511 $ 462 $ 381 $ 3,486
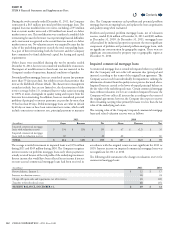
e Company’s annual in-depth review of its commercial mortgage
loan investments is the primary mechanism for identifying emerging
risks in the portfolio. e most recent review was completed by the
Company’s investment professionals in the second quarter of 2011
and included an analysis of each underlying property’s most recent
annual nancial statements, rent rolls, operating plans, budgets,
a physical inspection of the property and other pertinent factors.
Based on historical results, current leases, lease expirations and rental
conditions in each market, the Company estimates the current year
and future stabilized property income and fair value, and categorizes
the investments as loans in good standing, potential problem loans or
problem loans. Based on property valuations and cash ows estimated
as part of this review, and considering updates for loans where material
changes were subsequently identied, the portfolio’s average loan-to-
value ratio improved to 70% at December31,2011, decreasing from
74% as of December31,2010. e portfolio’s average debt service
coverage ratio was estimated to be 1.40 at December31,2011, a slight
increase from 1.38 at December31,2010.
Quality ratings are adjusted between annual reviews if new property
information is received or events such as delinquency or a borrower
request for restructure cause management to believe that the Company’s
estimate of nancial performance, fair value or the risk prole of the
underlying property has been impacted.
Contents
Q