Cigna 2011 Annual Report Download - page 57
Download and view the complete annual report
Please find page 57 of the 2011 Cigna annual report below. You can navigate through the pages in the report by either clicking on the pages listed below, or by using the keyword search tool below to find specific information within the annual report.-
 1
1 -
2
-
3
-
4
-
5
-
6
-
7
-
8
-
9
-
10
-
11
-
12
-
13
-
14
-
15
-
16
-
17
-
18
-
19
-
20
-
21
-
22
-
23
-
24
-
25
-
26
-
27
-
28
-
29
-
30
-
31
-
32
-
33
-
34
-
35
-
36
-
37
-
38
-
39
-
40
-
41
-
42
-
43
-
44
-
45
-
46
-
 47
47 -
 48
48 -
 49
49 -
 50
50 -
 51
51 -
 52
52 -
 53
53 -
 54
54 -
 55
55 -
 56
56 -
 57
57 -
 58
58 -
 59
59 -
 60
60 -
 61
61 -
 62
62 -
 63
63 -
 64
64 -
 65
65 -
 66
66 -
 67
67 -
68
-
69
-
70
-
71
-
72
-
73
-
74
-
75
-
76
-
77
-
78
-
79
-
80
-
81
-
82
-
83
-
84
-
85
-
86
-
87
-
88
-
89
-
90
-
91
-
92
-
93
-
94
-
95
-
96
-
97
-
98
-
99
-
100
-
101
-
102
-
103
-
104
-
105
-
106
-
107
-
108
-
109
-
110
-
111
-
112
-
113
-
114
-
115
-
116
-
117
-
118
-
119
-
120
-
121
-
122
-
123
-
124
-
125
-
126
-
127
-
128
-
129
-
130
-
131
-
132
-
133
-
134
-
135
-
136
-
137
-
138
-
139
-
140
-
141
-
142
-
143
-
144
-
145
-
146
-
147
-
148
-
149
-
150
-
151
-
152
-
153
-
154
-
155
-
156
-
157
-
158
-
159
-
160
-
161
-
162
-
163
-
164
-
165
-
166
-
167
-
168
-
169
-
170
-
171
-
172
-
173
-
174
-
175
-
176
-
177
-
178
-
179
-
180
 |
 |

35CIGNA CORPORATION2011 Form10K
PART II
ITEM 7 Management’s Discussion and Analysis of Financial Condition and Results of Operations
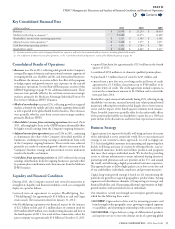
Key Consolidated Financial Data
(Dollars in millions)
2011 2010 2009
Revenues $ 21,998 $ 21,253 $ 18,414
Medical membership (in thousands)(1) 12,680 12,473 11,669
Shareholders’ income from continuing operations $ 1,327 $ 1,345 $ 1,301
Adjusted income from operations(2) $ 1,428 $ 1,277 $ 1,097
Cash ows from operating activities $ 1,491 $ 1,743 $ 745
Shareholders’ equity $ 8,344 $ 6,645 $ 5,417
(1) Includes medical members of the Company’s Health Care segment as well as the International health care business, including global health benefits.
(2) For a definition of adjusted income from operations, see the “Consolidated Results of Operations” section of this MD&A beginning on page38.
Consolidated Results of Operations
•
Revenues rose 4% in 2011, reecting solid growth in the Company’s
strategically targeted domestic and international customer segments of
its ongoing health care, disability and life, and international businesses.
In addition, the increase in revenue reects the eect of the programs
to hedge equity and growth interest rate exposures in the run-o
reinsurance operations. See the Run-o Reinsurance section of this
MD&A beginning on page51 for additional information. ese
increases were partially oset by the exit from certain non-strategic
markets, primarily the Medicare Advantage Individual Private Fee
For Service (“Medicare IPFFS”) business.
•
Medical membership increased 2%, reecting growth in targeted
markets, primarily the middle and select market segments domestically
as well as growth in the global health benets business. ese increases
were partially oset by exits from certain non-strategic markets,
primarily Medicare IPFFS.
•
Shareholders’ income from continuing operations decreased 1% in
2011, reecting higher losses in the GMIB business substantially oset
by higher overall earnings from the Company’s ongoing businesses.
•
Adjusted income from operations increased 12% in 2011, continuing
to demonstrate the value of the Company’s diversied portfolio of
businesses, resulting in strong earnings contributions from each
of the Company’s ongoing businesses. ese results were achieved
primarily as a result of continued growth, eective execution of the
Company’s business strategy and low medical services utilization
trend in the health care business.
•
Cash ows from operating activities in 2011 reected the strong
earnings contributions from the ongoing businesses, partially oset
by pension plan contributions and claim run-out from the Medicare
IPFFS business.
Liquidity and Financial Condition
During 2011, the Company entered into several transactions to
strengthen its liquidity and nancial condition as well as to strategically
deploy its capital as follows:
•
entered into an agreement to acquire HealthSpring,Inc.
(“HealthSpring”) for approximately $3.8billion in cash and Cigna
stock awards. e transaction closed on January31,2012;
•
the HealthSpring acquisition was nanced in part by the issuance
of $2.1billion of debt and 15.2million shares of common stock for
$650million ($629million, net of underwriting discount and fees) in
the fourth quarter of 2011. As a result of these transactions, cash at the
parent company was approximately $3.8billion at December31,2011;
•
acquired FirstAssist for approximately $115million in the fourth
quarter of 2011;
•contributed $250million to its domestic qualied pension plans;
•repurchased 5.3million shares of stock for $225million; and
•
entered into a new ve-year revolving credit and letter of credit
agreement for $1.5billion, that permits up to $500million to be
used for letters of credit. e credit agreement includes options to
increase the commitment amount to $2.0billion and to extend the
term past June2016.
Shareholders’ equity increased substantially during 2011, reecting strong
shareholders’ net income, increased invested asset values (primarily xed
maturities) reecting lower market yields (largely due to lower interest
rates), and the impact of the fourth quarter common stock issuance.
ose favorable items were partially oset by the unfavorable eects
of the pension plan liability on shareholders’ equity due to a 100basis
point decline in the discount rate and lower than expected asset returns.
Business Strategy
Cigna’s mission is to improve the health, well-being and sense of security
of the individuals it serves around the world. Key to our mission and
strategy is our customer-centric approach; we seek to engage our
U.S.-based and global customers in maintaining and improving their
health, well-being and sense of security by oering eective, easy-to-
understand insurance, health and wellness products and programs
that meet their unique individual needs. We do this by providing
access to relevant information to ensure informed buying decisions,
partnering with physicians and care providers in the U.S. and around
the world, and delivering a highly personalized customer experience.
is approach aims to deliver high quality care at lower costs for each
of our stakeholders: individuals, employers and government payors.
Cigna’s long-term growth strategy is based on:(1) repositioning the
portfolio for growth in targeted geographies, product lines, buying
segments and distribution channels;(2) improving its strategic and
nancial exibility; and(3) pursuing additional opportunities in high-
growth markets with particular focus on individuals.
Our mission is carried out through our enterprise growth strategy,
which has the following three tenets:
•
GO DEEP: Cigna seeks to drive scale by increasing presence and
brand strength in key geographic areas, growing in targeted segments
or capabilities, and deepening its relationships with current customers.
•
GO GLOBAL: Cigna delivers a range of dierentiated products
and superior service to meet the distinct needs of a growing global
Contents
Q