Cigna 2011 Annual Report Download - page 55
Download and view the complete annual report
Please find page 55 of the 2011 Cigna annual report below. You can navigate through the pages in the report by either clicking on the pages listed below, or by using the keyword search tool below to find specific information within the annual report.-
 1
1 -
2
-
3
-
4
-
5
-
6
-
7
-
8
-
9
-
10
-
11
-
12
-
13
-
14
-
15
-
16
-
17
-
18
-
19
-
20
-
21
-
22
-
23
-
24
-
25
-
26
-
27
-
28
-
29
-
30
-
31
-
32
-
33
-
34
-
35
-
36
-
37
-
38
-
39
-
40
-
41
-
42
-
43
-
44
-
 45
45 -
 46
46 -
 47
47 -
 48
48 -
 49
49 -
 50
50 -
 51
51 -
 52
52 -
 53
53 -
 54
54 -
 55
55 -
 56
56 -
 57
57 -
 58
58 -
 59
59 -
 60
60 -
 61
61 -
 62
62 -
 63
63 -
 64
64 -
 65
65 -
66
-
67
-
68
-
69
-
70
-
71
-
72
-
73
-
74
-
75
-
76
-
77
-
78
-
79
-
80
-
81
-
82
-
83
-
84
-
85
-
86
-
87
-
88
-
89
-
90
-
91
-
92
-
93
-
94
-
95
-
96
-
97
-
98
-
99
-
100
-
101
-
102
-
103
-
104
-
105
-
106
-
107
-
108
-
109
-
110
-
111
-
112
-
113
-
114
-
115
-
116
-
117
-
118
-
119
-
120
-
121
-
122
-
123
-
124
-
125
-
126
-
127
-
128
-
129
-
130
-
131
-
132
-
133
-
134
-
135
-
136
-
137
-
138
-
139
-
140
-
141
-
142
-
143
-
144
-
145
-
146
-
147
-
148
-
149
-
150
-
151
-
152
-
153
-
154
-
155
-
156
-
157
-
158
-
159
-
160
-
161
-
162
-
163
-
164
-
165
-
166
-
167
-
168
-
169
-
170
-
171
-
172
-
173
-
174
-
175
-
176
-
177
-
178
-
179
-
180
 |
 |

33CIGNA CORPORATION2011 Form10K
PART II
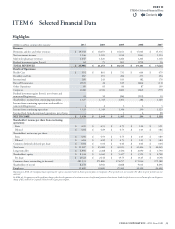
ITEM 6 Selected Financial Data
ITEM 6 Selected Financial Data
Highlights
(Dollars in millions, except per share amounts)
2011 2010 2009 2008 2007
Revenues
Premiums and fees and other revenues $ 19,343 $ 18,653 $ 16,161 $ 17,004 $ 15,376
Net investment income 1,146 1,105 1,014 1,063 1,114
Mail order pharmacy revenues 1,447 1,420 1,282 1,204 1,118
Realized investment gains (losses) 62 75 (43) (170) 16
TOTAL REVENUES $ 21,998 $ 21,253 $ 18,414 $ 19,101 $ 17,624
Results of Operations:
Health Care $ 991 $ 861 $ 731 $ 664 $ 679
Disability and Life 287 291 284 273 254
International 286 243 183 182 176
Run-o Reinsurance (183) 26 185 (646) (11)
Other Operations 89 85 86 87 109
Corporate (184) (211) (142) (162) (97)
Realized investment gains (losses), net of taxes and
noncontrolling interest 41 50 (26) (110) 10
Shareholders’ income from continuing operations 1,327 1,345 1,301 288 1,120
Income from continuing operations attributable to
noncontrolling interest 1 4 3 2 3
Income from continuing operations 1,328 1,349 1,304 290 1,123
Income (loss) from discontinued operations, net of taxes - - 1 4 (5)
NET INCOME $ 1,328 $ 1,349 $ 1,305 $ 294 $ 1,118
Shareholders’ income per share from continuing
operations:
Basic $ 4.90 $ 4.93 $ 4.75 $ 1.04 $ 3.91
Diluted $ 4.84 $ 4.89 $ 4.73 $ 1.03 $ 3.86
Shareholders’ net income per share:
Basic $ 4.90 $ 4.93 $ 4.75 $ 1.05 $ 3.89
Diluted $ 4.84 $ 4.89 $ 4.73 $ 1.05 $ 3.84
Common dividends declared per share $ 0.04 $ 0.04 $ 0.04 $ 0.04 $ 0.04
Total assets $ 51,047 $ 45,682 $ 43,013 $ 41,406 $ 40,065
Long-term debt $ 4,990 $ 2,288 $ 2,436 $ 2,090 $ 1,790
Shareholders’ equity $ 8,344 $ 6,645 $ 5,417 $ 3,592 $ 4,748
Per share $ 29.22 $ 24.44 $ 19.75 $ 13.25 $ 16.98
Common shares outstanding (in thousands) 285,533 271,880 274,257 271,036 279,588
Shareholders of record 8,178 8,568 8,888 9,014 8,696
Employees 31,400 30,600 29,300 30,300 26,600
Beginning in 2010, the Company began reporting the expense associated with its frozen pension plans in Corporate. Prior periods were not restated. The effect on prior periods was not
material.
In 2008, the Company recorded significant charges related to the guaranteed minimum income benefits and guaranteed minimum death benefits businesses as well as an after-tax litigation
charge of $52million in Corporate related to the Cigna pension plan.
Contents
Q