Cigna 2011 Annual Report Download - page 155
Download and view the complete annual report
Please find page 155 of the 2011 Cigna annual report below. You can navigate through the pages in the report by either clicking on the pages listed below, or by using the keyword search tool below to find specific information within the annual report.-
 1
1 -
2
-
3
-
4
-
5
-
6
-
7
-
8
-
9
-
10
-
11
-
12
-
13
-
14
-
15
-
16
-
17
-
18
-
19
-
20
-
21
-
22
-
23
-
24
-
25
-
26
-
27
-
28
-
29
-
30
-
31
-
32
-
33
-
34
-
35
-
36
-
37
-
38
-
39
-
40
-
41
-
42
-
43
-
44
-
45
-
46
-
47
-
48
-
49
-
50
-
51
-
52
-
53
-
54
-
55
-
56
-
57
-
58
-
59
-
60
-
61
-
62
-
63
-
64
-
65
-
66
-
67
-
68
-
69
-
70
-
71
-
72
-
73
-
74
-
75
-
76
-
77
-
78
-
79
-
80
-
81
-
82
-
83
-
84
-
85
-
86
-
87
-
88
-
89
-
90
-
91
-
92
-
93
-
94
-
95
-
96
-
97
-
98
-
99
-
100
-
101
-
102
-
103
-
104
-
105
-
106
-
107
-
108
-
109
-
110
-
111
-
112
-
113
-
114
-
115
-
116
-
117
-
118
-
119
-
120
-
121
-
122
-
123
-
124
-
125
-
126
-
127
-
128
-
129
-
130
-
131
-
132
-
133
-
134
-
135
-
136
-
137
-
138
-
139
-
140
-
141
-
142
-
143
-
144
-
 145
145 -
 146
146 -
 147
147 -
 148
148 -
 149
149 -
 150
150 -
 151
151 -
 152
152 -
 153
153 -
 154
154 -
 155
155 -
 156
156 -
 157
157 -
 158
158 -
 159
159 -
 160
160 -
 161
161 -
 162
162 -
 163
163 -
 164
164 -
 165
165 -
166
-
167
-
168
-
169
-
170
-
171
-
172
-
173
-
174
-
175
-
176
-
177
-
178
-
179
-
180
 |
 |

FS-3CIGNA CORPORATION2011 Form10K
ITEM 15 Exhibits and Financial Statement Schedules
PART IV
ITEM 15 Exhibits and Financial Statement Schedules
PART IV
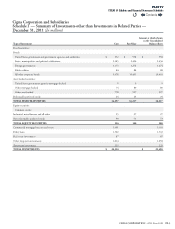
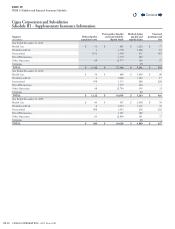
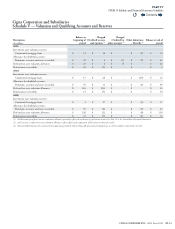
Cigna Corporation and Subsidiaries
Schedule I — Summary of Investments-other than Investments in Related Parties —
December 31, 2011 (Inmillions)
Type of Investment Cost Fair Value
Amount at which shown
in the Consolidated
Balance Sheet
Fixed maturities:
Bonds:
UnitedStates government and government agencies and authorities $ 552 $ 958 $ 958
States, municipalities and political subdivisions 2,185 2,456 2,456
Foreign governments 1,173 1,274 1,274
Public utilities 84 88 88
All other corporate bonds 9,378 10,401 10,401
Asset backed securities:
UnitedStates government agencies mortgage-backed 9 9 9
Other mortgage-backed 74 80 80
Other asset-backed 778 927 927
Redeemable preferred stocks 24 24 24
TOTAL FIXED MATURITIES 14,257 16,217 16,217
Equity securities:
Common stocks:
Industrial, miscellaneous and all other 25 27 27
Non redeemable preferred stocks 99 73 73
TOTAL EQUITY SECURITIES 124 100 100
Commercial mortgage loans on real estate 3,301 3,301
Policy loans 1,502 1,502
Real estate investments 87 87
Other long-term investments 1,014 1,058
Short-term investments 225 225
TOTAL INVESTMENTS $ 20,510 $ 22,490
Contents
Q