Cigna 2011 Annual Report Download - page 85
Download and view the complete annual report
Please find page 85 of the 2011 Cigna annual report below. You can navigate through the pages in the report by either clicking on the pages listed below, or by using the keyword search tool below to find specific information within the annual report.-
 1
1 -
2
-
3
-
4
-
5
-
6
-
7
-
8
-
9
-
10
-
11
-
12
-
13
-
14
-
15
-
16
-
17
-
18
-
19
-
20
-
21
-
22
-
23
-
24
-
25
-
26
-
27
-
28
-
29
-
30
-
31
-
32
-
33
-
34
-
35
-
36
-
37
-
38
-
39
-
40
-
41
-
42
-
43
-
44
-
45
-
46
-
47
-
48
-
49
-
50
-
51
-
52
-
53
-
54
-
55
-
56
-
57
-
58
-
59
-
60
-
61
-
62
-
63
-
64
-
65
-
66
-
67
-
68
-
69
-
70
-
71
-
72
-
73
-
74
-
 75
75 -
 76
76 -
 77
77 -
 78
78 -
 79
79 -
 80
80 -
 81
81 -
 82
82 -
 83
83 -
 84
84 -
 85
85 -
 86
86 -
 87
87 -
 88
88 -
 89
89 -
 90
90 -
 91
91 -
 92
92 -
 93
93 -
 94
94 -
 95
95 -
96
-
97
-
98
-
99
-
100
-
101
-
102
-
103
-
104
-
105
-
106
-
107
-
108
-
109
-
110
-
111
-
112
-
113
-
114
-
115
-
116
-
117
-
118
-
119
-
120
-
121
-
122
-
123
-
124
-
125
-
126
-
127
-
128
-
129
-
130
-
131
-
132
-
133
-
134
-
135
-
136
-
137
-
138
-
139
-
140
-
141
-
142
-
143
-
144
-
145
-
146
-
147
-
148
-
149
-
150
-
151
-
152
-
153
-
154
-
155
-
156
-
157
-
158
-
159
-
160
-
161
-
162
-
163
-
164
-
165
-
166
-
167
-
168
-
169
-
170
-
171
-
172
-
173
-
174
-
175
-
176
-
177
-
178
-
179
-
180
 |
 |

63CIGNA CORPORATION2011 Form10K
PART II
ITEM 7 Management’s Discussion and Analysis of Financial Condition and Results of Operations
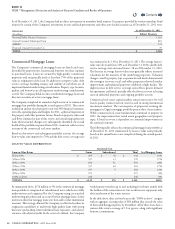
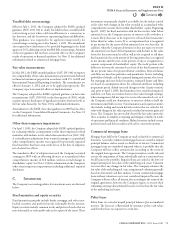
e commercial mortgage portfolio contains approximately 165 loans,
including four impaired loans, totaling $195million, that are classied
as problem loans, resulting in an aggregate default rate of 5.9%. All
of the remaining loans continue to perform under their contractual
terms. e Company has $529million of loans maturing in the next
twelve months. Given the quality and diversity of the underlying real
estate, positive debt service coverage and signicant borrower cash
investment averaging nearly 30%, the Company remains condent
that the vast majority of borrowers will continue to perform as expected
under the contract terms.
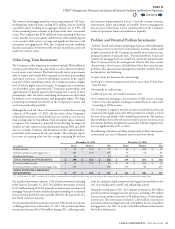
Other Long-Term Investments
e Company’s other long-term investments include $963million in
security partnership and real estate funds as well as direct investments
in real estate joint ventures. e funds typically invest in mezzanine
debt or equity of privately held companies (securities partnerships)
and equity real estate. Given its subordinate position in the capital
structure of these underlying entities, the Company assumes a higher
level of risk for higher expected returns. To mitigate risk, investments
are diversied across approximately 70 separate partnerships, and
approximately 45 general partners who manage one or more of these
partnerships. Also, the funds’ underlying investments are diversied
by industry sector or property type, and geographic region. No single
partnership investment exceeds 8% of the Company’s securities and
real estate partnership portfolio.
Although the total fair values of investments exceeded their carrying
values as of December31,2011, the fair value of the Company’s
ownership interest in certain funds that are carried at cost was less
than carrying value by $44million. Fund investment values continued
to improve, but remained at depressed levels reecting the impact of
declines in value experienced predominantly during 2008 and 2009
due to economic weakness and disruption in the capital markets,
particularly in the commercial real estate market. e Company expects
to recover its carrying value over the average remaining life of these
investments of approximately 6years. Given the current economic
environment, future impairments are possible; however, management
does not expect those losses to have a material eect on the Company’s
results of operations, nancial condition or liquidity.
Problem and Potential Problem Investments
“Problem” bonds and commercial mortgage loans are either delinquent
by 60days or more or have been restructured as to terms, which could
include concessions by the Company for modication of interest rate,
principal payment or maturity date. “Potential problem” bonds and
commercial mortgage loans are considered current (no payment more
than 59days past due), but management believes they have certain
characteristics that increase the likelihood that they may become
problems. e characteristics management considers include, but are
not limited to, the following:
•request from the borrower for restructuring;
•
principal or interest payments past due by more than 30 but fewer
than 60days;
•downgrade in credit rating;
•collateral losses on asset-backed securities; and
•
for commercial mortgages, deterioration of debt service coverage
below 1.0 or value declines resulting in estimated loan-to-value ratios
increasing to 100% or more.
e Company recognizes interest income on problem bonds and
commercial mortgage loans only when payment is actually received
because of the risk prole of the underlying investment. e amount
that would have been reected in net income if interest on non-accrual
investments had been recognized in accordance with the original terms
was not signicant for 2011 or 2010.
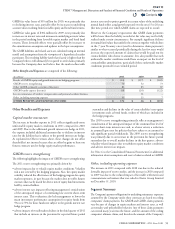
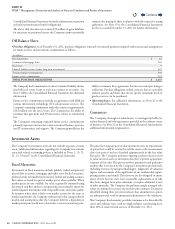
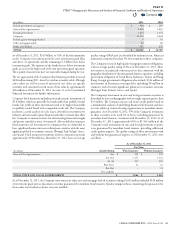
e following table shows problem and potential problem investments
at amortized cost, net of valuation reserves and write-downs:
(In millions)
December31,2011 December31,2010
Gross Reserve Net Gross Reserve Net
Problem bonds $ 40 $ (13) $ 27 $ 86 $ (39) $ 47
Problem commercial mortgage loans(1) 224 (19) 205 90 (4) 86
Foreclosed real estate 34 - 34 59 - 59
TOTAL PROBLEM INVESTMENTS $ 298 $ 32 $ 266 $ 235 $ 43 $ 192
Potential problem bonds $ 36 $ (10) $ 26 $ 40 $ (10) $ 30
Potential problem commercial mortgage loans 141 - 141 305 (8) 297
TOTAL POTENTIAL PROBLEM
INVESTMENTS $ 177 $ 10 $ 167 $ 345 $ 18 $ 327
(1) At December31,2011, includes a $10million restructured loan classified in Other long-term investments that was previously reported in commercial mortgage loans.
Net problem investments represent 1.3% of total investments excluding
policy loans at December31,2011. Net problem investments increased
by $74million during 2011 due primarily to deterioration of commercial
mortgage loans previously considered in good standing or reclassied
from potential problem loans, partially oset by the partial sale of a
foreclosed real estate property.
Net potential problem investments represent .8% of total investments
excluding policy loans at December31,2011. Net potential problem
investments decreased by $160million during 2011, reecting results
from the annual in-depth commercial mortgage loan portfolio review
and loan modication, payo, and renancing activity.
During the second quarter 2011, the Company restructured a $65million
potential problem mortgage loan into two loans, including a $55million
loan at current market terms and a $10million loan at a below market
interest rate. is restructure resulted in a $65million reduction to
potential problem mortgage loans and a $10million increase to problem
mortgage loans. See Note11 to the Consolidated Financial Statements
for further information.
Contents
Q