Cigna 2011 Annual Report Download - page 73
Download and view the complete annual report
Please find page 73 of the 2011 Cigna annual report below. You can navigate through the pages in the report by either clicking on the pages listed below, or by using the keyword search tool below to find specific information within the annual report.-
 1
1 -
2
-
3
-
4
-
5
-
6
-
7
-
8
-
9
-
10
-
11
-
12
-
13
-
14
-
15
-
16
-
17
-
18
-
19
-
20
-
21
-
22
-
23
-
24
-
25
-
26
-
27
-
28
-
29
-
30
-
31
-
32
-
33
-
34
-
35
-
36
-
37
-
38
-
39
-
40
-
41
-
42
-
43
-
44
-
45
-
46
-
47
-
48
-
49
-
50
-
51
-
52
-
53
-
54
-
55
-
56
-
57
-
58
-
59
-
60
-
61
-
62
-
 63
63 -
 64
64 -
 65
65 -
 66
66 -
 67
67 -
 68
68 -
 69
69 -
 70
70 -
 71
71 -
 72
72 -
 73
73 -
 74
74 -
 75
75 -
 76
76 -
 77
77 -
 78
78 -
 79
79 -
 80
80 -
 81
81 -
 82
82 -
 83
83 -
84
-
85
-
86
-
87
-
88
-
89
-
90
-
91
-
92
-
93
-
94
-
95
-
96
-
97
-
98
-
99
-
100
-
101
-
102
-
103
-
104
-
105
-
106
-
107
-
108
-
109
-
110
-
111
-
112
-
113
-
114
-
115
-
116
-
117
-
118
-
119
-
120
-
121
-
122
-
123
-
124
-
125
-
126
-
127
-
128
-
129
-
130
-
131
-
132
-
133
-
134
-
135
-
136
-
137
-
138
-
139
-
140
-
141
-
142
-
143
-
144
-
145
-
146
-
147
-
148
-
149
-
150
-
151
-
152
-
153
-
154
-
155
-
156
-
157
-
158
-
159
-
160
-
161
-
162
-
163
-
164
-
165
-
166
-
167
-
168
-
169
-
170
-
171
-
172
-
173
-
174
-
175
-
176
-
177
-
178
-
179
-
180
 |
 |

51CIGNA CORPORATION2011 Form10K
PART II
ITEM 7 Management’s Discussion and Analysis of Financial Condition and Results of Operations
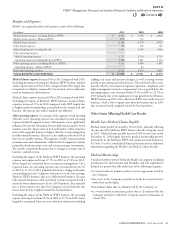
Net investment income increased by 17% in 2011, compared with
2010, and 19% in 2010, compared with 2009. ese increases were
primarily due to asset growth in South Korea and favorable foreign
currency movements in South Korea.
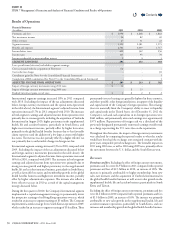
Benefits and Expenses
Excluding the impact of foreign currency movements, benets and
expenses were $2.6billion in 2011, compared to reported benets
and expenses of $2.0billion in 2010, an increase of 29%. e increase
was primarily due to business growth, the acquisition of Vanbreda
International and higher loss ratios, primarily in the global health
benets business, reecting less favorable claims experience and the
addition of a few larger cases with higher loss ratios.
Excluding the impact of foreign currency movements, benets and
expenses were $2.0billion in 2010, compared with reported benets and
expenses of $1.7billion in 2009, an increase of 15%. e increase was
primarily due to business growth and higher claims in the supplemental
health, life and accident insurance business, particularly in South Korea.
Loss ratios were higher in the global health benets business in 2011
compared with 2010, reecting less favorable claims experience and
the addition of a few larger cases with inherently higher loss ratios. Loss
ratios were at in the supplemental health, life and accident insurance
business in 2011, compared with 2010.
Policy acquisition expenses increased in 2011 compared with 2010 as
well as in 2010 compared with 2009 reecting business growth and
foreign currency movements.
Excluding the special items (presented in the table above), expense
ratios were at in 2011 compared with 2010, primarily due to higher
revenues in the global health benets business and in the supplemental
health, life and accident insurance business, primarily in Korea, oset
by strategic investments for future growth and costs to streamline
operations. Expense ratios increased in 2010 compared with 2009,
reecting the higher expense ratios associated with the service nature
of the Vanbreda International business acquired in the third quarter
of 2010.
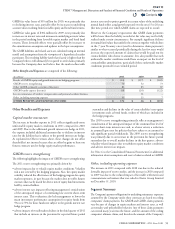
Other Items Affecting International Results
For theCompany’s International segment, South Korea is the single
largest geographic market. South Korea generated 31% of the segment’s
revenues and 51% of the segment’s earnings in 2011. Due to the
concentration of business in South Korea, the International segment
is exposed to potential losses resulting from economic and geopolitical
developments in that country, as well as foreign currency movements
aecting the South Korean currency, which could have a signicant
impact on the segment’s results and the Company’s consolidated
nancial results.
In November2011, the Company acquired FirstAssist Group Holdings
Limited (“FirstAssist”) for approximately $115million. FirstAssist
is based in the United Kingdom (“U.K.”) and provides travel and
protection insurance services that the Company expects will enhance its
supplemental health, life and accident business around the world. e
Company used available cash on hand for the purchase. e earnings
contribution of FirstAssist was immaterial in 2011, and is expected
to be accretive in 2012.
In 2012, the Company will implement the new requirements of
accounting for costs related to the acquisition or renewal of insurance
contracts. See Note2 to the Consolidated Financial Statements for
additional information.
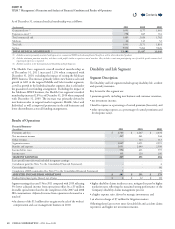
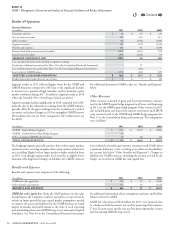
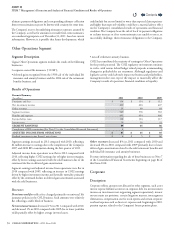
Run-off Reinsurance Segment
Segment Description
is segment is predominantly comprised of guaranteed minimum death
benet (“GMDB”, also known as “VADBe”) and guaranteed minimum
income benet (“GMIB”) products. e Company’s reinsurance
operations were discontinued and are now an inactive business in
run-o mode since the sale of the U.S. individual life, group life and
accidental death reinsurance business in 2000. In December2010, the
Company essentially exited from its workers’ compensation and personal
accident reinsurance business by purchasing retrocessional coverage from
a Bermuda subsidiary of Enstar Group Limited and transferring the
ongoing administration of this business to the reinsurer. See Note3 to
the Consolidated Financial Statements in this Form10-K for further
information regarding this transaction. e 2010 special item loss
reects the after-tax costs of this transaction. Segment results prior to
this transaction also included results from its workers’ compensation
and personal accident reinsurance business.
e determination of liabilities for GMDB and GMIB requires the
Company to make critical accounting estimates. e Company describes
the assumptions used to develop the reserves for GMDB in Note6 to
the Consolidated Financial Statements and for the assets and liabilities
associated with GMIB in Note10 to the Consolidated Financial
Statements. e Company also provides the eects of hypothetical
changes in those assumptions in the Critical Accounting Estimates
section of the MD&A beginning on page41 of this Form10-K.
e Company excludes the results of the GMIB business from adjusted
income from operations because the fair value of GMIB assets and
liabilities must be recalculated each quarter using updated capital
market assumptions. e resulting changes in fair value, which are
reported in shareholders’ net income, are volatile and unpredictable.
Contents
Q