Cigna 2011 Annual Report Download - page 129
Download and view the complete annual report
Please find page 129 of the 2011 Cigna annual report below. You can navigate through the pages in the report by either clicking on the pages listed below, or by using the keyword search tool below to find specific information within the annual report.-
 1
1 -
2
-
3
-
4
-
5
-
6
-
7
-
8
-
9
-
10
-
11
-
12
-
13
-
14
-
15
-
16
-
17
-
18
-
19
-
20
-
21
-
22
-
23
-
24
-
25
-
26
-
27
-
28
-
29
-
30
-
31
-
32
-
33
-
34
-
35
-
36
-
37
-
38
-
39
-
40
-
41
-
42
-
43
-
44
-
45
-
46
-
47
-
48
-
49
-
50
-
51
-
52
-
53
-
54
-
55
-
56
-
57
-
58
-
59
-
60
-
61
-
62
-
63
-
64
-
65
-
66
-
67
-
68
-
69
-
70
-
71
-
72
-
73
-
74
-
75
-
76
-
77
-
78
-
79
-
80
-
81
-
82
-
83
-
84
-
85
-
86
-
87
-
88
-
89
-
90
-
91
-
92
-
93
-
94
-
95
-
96
-
97
-
98
-
99
-
100
-
101
-
102
-
103
-
104
-
105
-
106
-
107
-
108
-
109
-
110
-
111
-
112
-
113
-
114
-
115
-
116
-
117
-
118
-
 119
119 -
 120
120 -
 121
121 -
 122
122 -
 123
123 -
 124
124 -
 125
125 -
 126
126 -
 127
127 -
 128
128 -
 129
129 -
 130
130 -
 131
131 -
 132
132 -
 133
133 -
 134
134 -
 135
135 -
 136
136 -
 137
137 -
 138
138 -
 139
139 -
140
-
141
-
142
-
143
-
144
-
145
-
146
-
147
-
148
-
149
-
150
-
151
-
152
-
153
-
154
-
155
-
156
-
157
-
158
-
159
-
160
-
161
-
162
-
163
-
164
-
165
-
166
-
167
-
168
-
169
-
170
-
171
-
172
-
173
-
174
-
175
-
176
-
177
-
178
-
179
-
180
 |
 |

107CIGNA CORPORATION2011 Form10K
PART II
ITEM 8 Financial Statements and Supplementary Data
Note 14 Investment Income and Gains and Losses
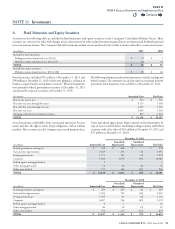
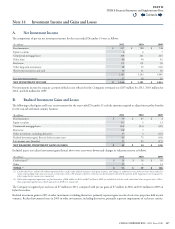
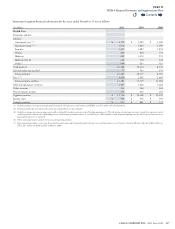
A. Net Investment Income
e components of pre-tax net investment income for the years ended December31 were as follows:
(In millions)
2011 2010 2009
Fixed maturities $ 817 $ 788 $ 748
Equity securities 6 6 7
Commercial mortgage loans 218 221 223
Policy loans 86 90 92
Real estate (2) (2) (1)
Other long-term investments 48 29 (30)
Short-term investments and cash 10 11 10
1,183 1,143 1,049
Less investment expenses 37 38 35
NET INVESTMENT INCOME $ 1,146 $ 1,105 $ 1,014
Net investment income for separate accounts (which is not reected in the Company’s revenues) was $207million for 2011, $163million for
2010, and $22million for 2009.
B. Realized Investment Gains and Losses
e following realized gains and losses on investments for the years ended December31 exclude amounts required to adjust future policy benets
for the run-o settlement annuity business.
(In millions)
2011 2010 2009
Fixed maturities $ 50 $ 87 $ 2
Equity securities (1) 5 12
Commercial mortgage loans (16) (23) (20)
Real estate (6) 3 -
Other investments, including derivatives 35 3 (37)
Realized investment gains (losses), before income taxes 62 75 (43)
Less income taxes (benets) 21 25 (17)
NET REALIZED INVESTMENT GAINS LOSSES $ 41 $ 50 $ 26
Included in pre-tax realized investment gains (losses) above were asset write-downs and changes in valuation reserves as follows:
(In millions)
2011 2010 2009
Credit related(1) $ 28 $ 38 $ 93
Other 25 1 13
TOTAL2 $ 53 $ 39 $ 106
(1) Credit-related losses include other-than-temporary declines in fair value of fixed maturities and equity securities, and changes in valuation reserves and asset write-downs related to
commercial mortgage loans and investments in real estate entities. The amount related to credit losses on fixed maturities for which a portion of the impairment was recognized in
other comprehensive income were immaterial.
(2) Other-than-temporary impairments on fixed maturities of $26million in 2011 and $47million in 2009 are included in both the credit-related and other categories above. Other-
than-temporary impairments on fixed maturities in 2010 were immaterial.
e Company recognized pre-tax losses of $7million in 2011, compared with pre-tax gains of $7million in 2010 and $13million in 2009 on
hybrid securities.
Realized investment gains in 2011 in other investments, including derivatives, primarily represent gains on sale of real estate properties held in joint
ventures. Realized investment losses in 2009 in other investments, including derivatives, primarily represent impairments of real estate entities.
Contents
Q