Cigna 2011 Annual Report Download - page 158
Download and view the complete annual report
Please find page 158 of the 2011 Cigna annual report below. You can navigate through the pages in the report by either clicking on the pages listed below, or by using the keyword search tool below to find specific information within the annual report.-
 1
1 -
2
-
3
-
4
-
5
-
6
-
7
-
8
-
9
-
10
-
11
-
12
-
13
-
14
-
15
-
16
-
17
-
18
-
19
-
20
-
21
-
22
-
23
-
24
-
25
-
26
-
27
-
28
-
29
-
30
-
31
-
32
-
33
-
34
-
35
-
36
-
37
-
38
-
39
-
40
-
41
-
42
-
43
-
44
-
45
-
46
-
47
-
48
-
49
-
50
-
51
-
52
-
53
-
54
-
55
-
56
-
57
-
58
-
59
-
60
-
61
-
62
-
63
-
64
-
65
-
66
-
67
-
68
-
69
-
70
-
71
-
72
-
73
-
74
-
75
-
76
-
77
-
78
-
79
-
80
-
81
-
82
-
83
-
84
-
85
-
86
-
87
-
88
-
89
-
90
-
91
-
92
-
93
-
94
-
95
-
96
-
97
-
98
-
99
-
100
-
101
-
102
-
103
-
104
-
105
-
106
-
107
-
108
-
109
-
110
-
111
-
112
-
113
-
114
-
115
-
116
-
117
-
118
-
119
-
120
-
121
-
122
-
123
-
124
-
125
-
126
-
127
-
128
-
129
-
130
-
131
-
132
-
133
-
134
-
135
-
136
-
137
-
138
-
139
-
140
-
141
-
142
-
143
-
144
-
145
-
146
-
147
-
 148
148 -
 149
149 -
 150
150 -
 151
151 -
 152
152 -
 153
153 -
 154
154 -
 155
155 -
 156
156 -
 157
157 -
 158
158 -
 159
159 -
 160
160 -
 161
161 -
 162
162 -
 163
163 -
 164
164 -
 165
165 -
 166
166 -
 167
167 -
 168
168 -
169
-
170
-
171
-
172
-
173
-
174
-
175
-
176
-
177
-
178
-
179
-
180
 |
 |

FS-6 CIGNA CORPORATION2011 Form10K
PART IV
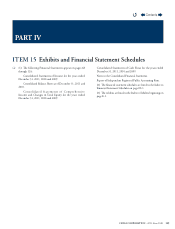
ITEM 15 Exhibits and Financial Statement Schedules
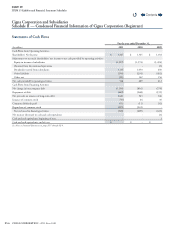
Cigna Corporation and Subsidiaries
Schedule II — Condensed Financial Information of Cigna Corporation (Registrant)
Statements of Cash Flows
(In millions)
For the year ended December31,
2011 2010 2009
Cash Flows from Operating Activities:
Shareholders’ Net Income $ 1,327 $ 1,345 $ 1,302
Adjustments to reconcile shareholders’ net income to net cash provided by operating activities:
Equity in income of subsidiaries (1,527) (1,574) (1,494)
(Income) from discontinued operations - - (1)
Dividends received from subsidiaries 1,135 1,050 650
Other liabilities (296) (294) (401)
Other, net (91) 162 356
Net cash provided by operating activities 548 689 412
Cash Flows from Financing Activities:
Net change in intercompany debt (3,258) (816) (579)
Repayment of debt (449) (268) (199)
Net proceeds on issuance of long-term debt 2,661 543 346
Issuance of common stock 734 64 30
Common dividends paid (11) (11) (11)
Repurchase of common stock (225) (201) -
Net cash used in nancing activities (548) (689) (413)
Net increase (decrease) in cash and cash equivalents - - (1)
Cash and cash equivalents, beginning of year - - 1
Cash and cash equivalents, end of year $ - $ - $ -
See Notesto Financial Statements on pages FS-7 through FS-9.
Contents
Q