Cigna 2011 Annual Report Download - page 69
Download and view the complete annual report
Please find page 69 of the 2011 Cigna annual report below. You can navigate through the pages in the report by either clicking on the pages listed below, or by using the keyword search tool below to find specific information within the annual report.-
 1
1 -
2
-
3
-
4
-
5
-
6
-
7
-
8
-
9
-
10
-
11
-
12
-
13
-
14
-
15
-
16
-
17
-
18
-
19
-
20
-
21
-
22
-
23
-
24
-
25
-
26
-
27
-
28
-
29
-
30
-
31
-
32
-
33
-
34
-
35
-
36
-
37
-
38
-
39
-
40
-
41
-
42
-
43
-
44
-
45
-
46
-
47
-
48
-
49
-
50
-
51
-
52
-
53
-
54
-
55
-
56
-
57
-
58
-
 59
59 -
 60
60 -
 61
61 -
 62
62 -
 63
63 -
 64
64 -
 65
65 -
 66
66 -
 67
67 -
 68
68 -
 69
69 -
 70
70 -
 71
71 -
 72
72 -
 73
73 -
 74
74 -
 75
75 -
 76
76 -
 77
77 -
 78
78 -
 79
79 -
80
-
81
-
82
-
83
-
84
-
85
-
86
-
87
-
88
-
89
-
90
-
91
-
92
-
93
-
94
-
95
-
96
-
97
-
98
-
99
-
100
-
101
-
102
-
103
-
104
-
105
-
106
-
107
-
108
-
109
-
110
-
111
-
112
-
113
-
114
-
115
-
116
-
117
-
118
-
119
-
120
-
121
-
122
-
123
-
124
-
125
-
126
-
127
-
128
-
129
-
130
-
131
-
132
-
133
-
134
-
135
-
136
-
137
-
138
-
139
-
140
-
141
-
142
-
143
-
144
-
145
-
146
-
147
-
148
-
149
-
150
-
151
-
152
-
153
-
154
-
155
-
156
-
157
-
158
-
159
-
160
-
161
-
162
-
163
-
164
-
165
-
166
-
167
-
168
-
169
-
170
-
171
-
172
-
173
-
174
-
175
-
176
-
177
-
178
-
179
-
180
 |
 |
47CIGNA CORPORATION2011 Form10K
PART II
ITEM 7 Management’s Discussion and Analysis of Financial Condition and Results of Operations
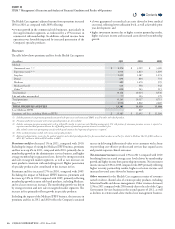
Benefits and Expenses
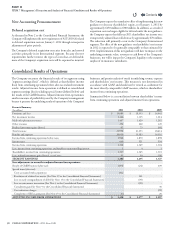
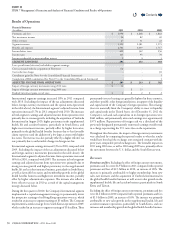
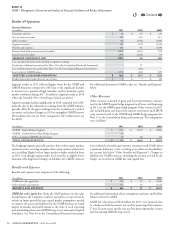
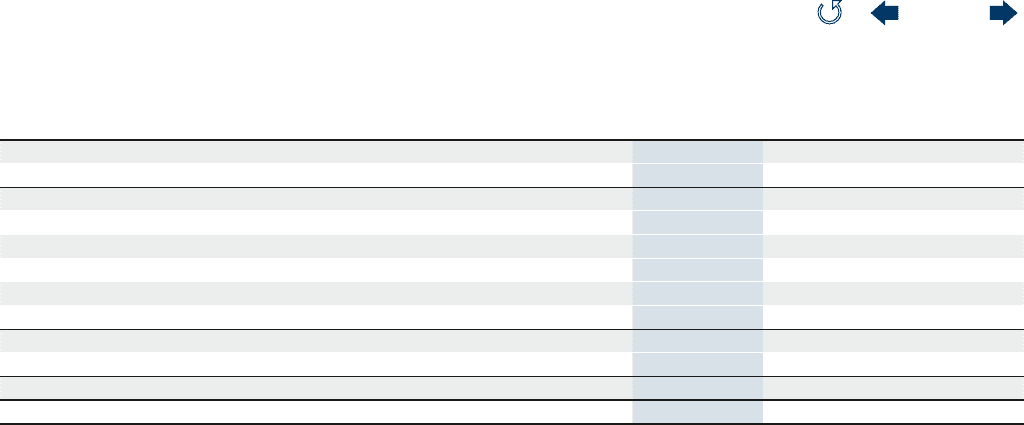
Health Care segment benets and expenses consist of the following:
(In millions)
2011 2010 2009
Medical claims expense - excluding Medicare IPFFS $ 8,201 $ 7,798 $ 6,927
Medical claims expense - Medicare IPFFS (19) 772 -
Medical claims expense 8,182 8,570 6,927
Other benet expenses 83 100 169
Mail order pharmacy cost of goods sold 1,203 1,169 1,036
Other operating expenses:
Medical operating expenses 2,757 2,739 2,723
Operating expenses (excluding Medicare IPFFS) 1,364 1,251 1,124
Other operating expenses (excluding Medicare IPFFS) 4,121 3,990 3,847
Operating expenses - Medicare IPFFS - 82 -
Total other operating expenses 4,121 4,072 3,847
TOTAL BENEFITS AND EXPENSES $ 13,589 $ 13,911 $ 11,979
Medical claims expense decreased 5% in 2011 compared with 2010.
Excluding the impact of exiting the Medicare IPFFS business, medical
claims expense increased 5% in 2011 compared with 2010, largely due
to medical cost ination, tempered by low medical services utilization
trend in commercial risk businesses.
Medical claims expense increased 24% in 2010 compared with 2009.
Excluding the impact of Medicare IPFFS business, medical claims
expenses increased 13% in 2010 compared with 2009 largely due
to higher medical membership, particularly in the commercial risk
business. e increase also reects medical cost ination.
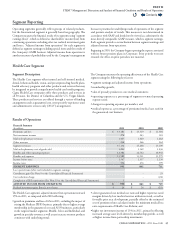
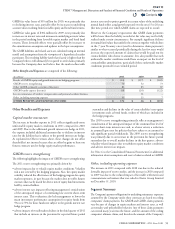
Other operating expenses. One measure of the segment’s overall operating
eciency is the operating expense ratio calculated as total operating
expenses divided by segment revenues. is measure can be signicantly
inuenced by the mix of business between fully-insured and fee-based
business, since the expense ratio on fee-based business, which comprises
most of the segment’s business is higher than the corresponding ratio
for fully-insured business. e ratio is also inuenced by the level of
xed versus variable expenses. e segment’s variable expenses include
premium taxes and commissions, while the xed component consists
primarily of infrastructure costs and certain strategic investments.
e variable component uctuates due to changes in revenue, mix of
business, and other items.
Excluding the impact of the Medicare IPFFS business, the operating
expense ratio improved from 27.7% in 2010 to 27.2% in 2011,
driven largely by continued focus on expense management. On a
reported basis, the operating expense ratio increased from 26.7%
in 2010 to 27.2% in 2011 primarily driven by a change in business
mix resulting from the Company’s decision to exit the non-strategic
Medicare IPFFS business, that was a fully-insured business. Because
fully-insured businesses collect premium revenue (compared with a
relatively lower administrative fee for ASO business), they typically
have a lower expense ratio than the Company’s current business mix
that is more heavily weighted toward fee-based products.
Excluding the impact of the Medicare IPFFS business, the operating
expense ratio improved from 29.3% in 2009 to 27.7% in 2010, driven
largely by continued focus on cost reduction initiatives including
stang, real estate and pension changes, as well as strong revenue
growth in the commercial risk businesses. ese favorable eects were
partially oset by investment in segment expansion, compliance and
higher management incentive compensation. On a reported basis, the
operating expense ratio decreased from 29.3% in 2009 to 26.7% in
2010 primarily due to the signicant revenue growth in the Medicare
IPFFS business in 2010. Since Medicare IPFFS was a fully-insured
business, it had a lower expense ratio than the business mix in 2009
that was more heavily weighted toward fee-based products.
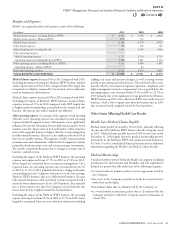
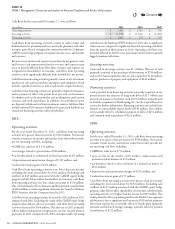
Other Items Affecting Health Care Results
Health Care Medical Claims Payable
Medical claims payable decreased by 12% in 2011, primarily reecting
the run-out of the Medicare IPFFS business that the Company exited
in 2011. Medical claims payable increased 35% for the year ended
December31,2010 largely driven by medical membership growth,
particularly in the Medicare IPFFS and commercial risk businesses.
See Note5 to the Consolidated Financial Statements for additional
information regarding the Health Care Medical Claims Payable.
Medical Membership
A medical member reported within the Health Care segment (excluding
members in the International and Disability and Life segments) is
dened as a person who falls within one of the following categories:
•is covered under an insurance policy or service agreement issued by
the Company;
•
has access to the Company’s provider network for covered services
under their medical plan;
•has medical claims that are administered by the Company; or
•
is covered under an insurance policy that is (i) marketed by the
Company and (ii) for which the Company assumes reinsurance of
at least 50%.
Contents
Q