Cigna 2011 Annual Report Download - page 113
Download and view the complete annual report
Please find page 113 of the 2011 Cigna annual report below. You can navigate through the pages in the report by either clicking on the pages listed below, or by using the keyword search tool below to find specific information within the annual report.-
 1
1 -
2
-
3
-
4
-
5
-
6
-
7
-
8
-
9
-
10
-
11
-
12
-
13
-
14
-
15
-
16
-
17
-
18
-
19
-
20
-
21
-
22
-
23
-
24
-
25
-
26
-
27
-
28
-
29
-
30
-
31
-
32
-
33
-
34
-
35
-
36
-
37
-
38
-
39
-
40
-
41
-
42
-
43
-
44
-
45
-
46
-
47
-
48
-
49
-
50
-
51
-
52
-
53
-
54
-
55
-
56
-
57
-
58
-
59
-
60
-
61
-
62
-
63
-
64
-
65
-
66
-
67
-
68
-
69
-
70
-
71
-
72
-
73
-
74
-
75
-
76
-
77
-
78
-
79
-
80
-
81
-
82
-
83
-
84
-
85
-
86
-
87
-
88
-
89
-
90
-
91
-
92
-
93
-
94
-
95
-
96
-
97
-
98
-
99
-
100
-
101
-
102
-
 103
103 -
 104
104 -
 105
105 -
 106
106 -
 107
107 -
 108
108 -
 109
109 -
 110
110 -
 111
111 -
 112
112 -
 113
113 -
 114
114 -
 115
115 -
 116
116 -
 117
117 -
 118
118 -
 119
119 -
 120
120 -
 121
121 -
 122
122 -
 123
123 -
124
-
125
-
126
-
127
-
128
-
129
-
130
-
131
-
132
-
133
-
134
-
135
-
136
-
137
-
138
-
139
-
140
-
141
-
142
-
143
-
144
-
145
-
146
-
147
-
148
-
149
-
150
-
151
-
152
-
153
-
154
-
155
-
156
-
157
-
158
-
159
-
160
-
161
-
162
-
163
-
164
-
165
-
166
-
167
-
168
-
169
-
170
-
171
-
172
-
173
-
174
-
175
-
176
-
177
-
178
-
179
-
180
 |
 |

91CIGNA CORPORATION2011 Form10K
PART II
ITEM 8 Financial Statements and Supplementary Data
equity securities as well as real estate, securities partnerships and hedge
funds. Expected long-term market conditions take into consideration
certain key macroeconomic trends including expected domestic and
foreign GDP growth, employment levels and ination. Based on the
Company’s current outlook, the expected return assumption is considered
reasonable. e actual investment allocation at December31,2011
is more heavily weighted towards equity securities than targeted. e
Company expects the allocation of equity securities to move closer
to target during 2012 as additional attractive alternative investments
(securities partnerships and hedge funds) can be identied.
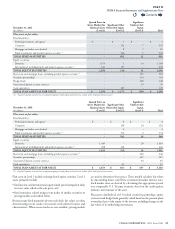
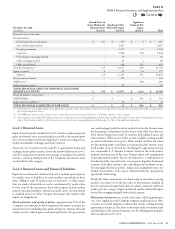
To measure pension costs, the Company uses a market-related asset
valuation for domestic pension plan assets invested in non-xed income
investments. e market-related value of these pension assets recognizes
the dierence between actual and expected long-term returns in the
portfolio over 5 years, a method that reduces the short-term impact
of market uctuations on pension cost. At December31,2011, the
market-related asset value was approximately $3.4billion compared
with a market value of approximately $3.3billion.
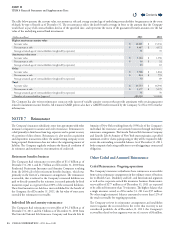
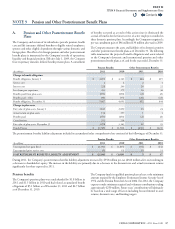
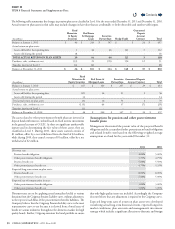
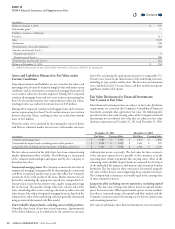
Benefit payments
e following benet payments, including expected future services, are expected to be paid in:
(In millions)
Pension Benets
Other Postretirement Benets
Gross
Net of Medicare
PartD Subsidy
2012 $ 516 $ 43 $ 39
2013 $ 338 $ 41 $ 39
2014 $ 340 $ 40 $ 38
2015 $ 327 $ 39 $ 38
2016 $ 323 $ 38 $ 37
2017-2021 $ 1,577 $ 169 $ 162
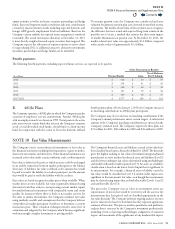
B. 401(k) Plans
e Company sponsors a 401(k) plan in which the Company matches
a portion of employees’ pre-tax contributions. Another 401(k) plan
with an employer match was frozen in 1999. Participants in the active
plan may invest in various funds that invest in the Company’s common
stock, several diversied stock funds, a bond fund or a xed-income
fund. In conjunction with the action to freeze the domestic dened
benet pension plans, eective January1,2010, the Company increased
its matching contributions to 401(k) plan participants.
e Company may elect to increase its matching contributions if the
Company’s annual performance meets certain targets. A substantial
amount of the Company’s matching contributions are invested in the
Company’s common stock. e Company’s expense for these plans was
$72million for 2011, $69million for 2010 and $36million for 2009.
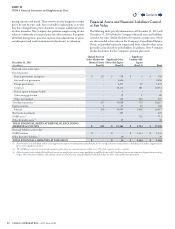
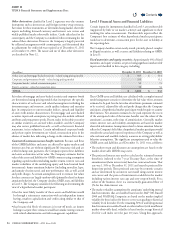
NOTE 10 Fair Value Measurements
e Company carries certain nancial instruments at fair value in
the nancial statements including xed maturities, equity securities,
short-term investments and derivatives. Other nancial instruments are
measured at fair value under certain conditions, such as when impaired.
Fair value is dened as the price at which an asset could be exchanged
in an orderly transaction between market participants at the balance
sheet date. A liability’s fair value is dened as the amount that would
be paid to transfer the liability to a market participant, not the amount
that would be paid to settle the liability with the creditor.
Fair values are based on quoted market prices when available. When
market prices are not available, fair value is generally estimated using
discounted cash ow analyses, incorporating current market inputs
for similar nancial instruments with comparable terms and credit
quality. In instances where there is little or no market activity for
the same or similar instruments, the Company estimates fair value
using methods, models and assumptions that the Company believes
a hypothetical market participant would use to determine a current
transaction price. ese valuation techniques involve some level of
estimation and judgment by the Company which becomes signicant
with increasingly complex instruments or pricing models.
e Company’s nancial assets and liabilities carried at fair value have
been classied based upon a hierarchy dened by GAAP. e hierarchy
gives the highest ranking to fair values determined using unadjusted
quoted prices in active markets for identical assets and liabilities (Level1)
and the lowest ranking to fair values determined using methodologies
and models with unobservable inputs (Level3). An asset’s or a liability’s
classication is based on the lowest level of input that is signicant to
its measurement. For example, a nancial asset or liability carried at
fair value would be classied in Level3 if unobservable inputs were
signicant to the instrument’s fair value, even though the measurement
may be derived using inputs that are both observable (Levels 1 and 2)
and unobservable (Level3).
e prices the Company uses to value its investment assets are
representative of prices that would be received to sell the assets at the
measurement date (exit prices) and are classied appropriately in the
fair value hierarchy. e Company performs ongoing analyses of prices
used to value invested assets to determine that they represent appropriate
estimates of fair value. is process involves quantitative and qualitative
analysis that is overseen by the Company’s investment professionals,
including reviews of pricing methodologies, judgments of valuation
inputs, and assessments of the signicance of any unobservable inputs,
Contents
Q