Cigna 2011 Annual Report Download - page 65
Download and view the complete annual report
Please find page 65 of the 2011 Cigna annual report below. You can navigate through the pages in the report by either clicking on the pages listed below, or by using the keyword search tool below to find specific information within the annual report.-
 1
1 -
2
-
3
-
4
-
5
-
6
-
7
-
8
-
9
-
10
-
11
-
12
-
13
-
14
-
15
-
16
-
17
-
18
-
19
-
20
-
21
-
22
-
23
-
24
-
25
-
26
-
27
-
28
-
29
-
30
-
31
-
32
-
33
-
34
-
35
-
36
-
37
-
38
-
39
-
40
-
41
-
42
-
43
-
44
-
45
-
46
-
47
-
48
-
49
-
50
-
51
-
52
-
53
-
54
-
 55
55 -
 56
56 -
 57
57 -
 58
58 -
 59
59 -
 60
60 -
 61
61 -
 62
62 -
 63
63 -
 64
64 -
 65
65 -
 66
66 -
 67
67 -
 68
68 -
 69
69 -
 70
70 -
 71
71 -
 72
72 -
 73
73 -
 74
74 -
 75
75 -
76
-
77
-
78
-
79
-
80
-
81
-
82
-
83
-
84
-
85
-
86
-
87
-
88
-
89
-
90
-
91
-
92
-
93
-
94
-
95
-
96
-
97
-
98
-
99
-
100
-
101
-
102
-
103
-
104
-
105
-
106
-
107
-
108
-
109
-
110
-
111
-
112
-
113
-
114
-
115
-
116
-
117
-
118
-
119
-
120
-
121
-
122
-
123
-
124
-
125
-
126
-
127
-
128
-
129
-
130
-
131
-
132
-
133
-
134
-
135
-
136
-
137
-
138
-
139
-
140
-
141
-
142
-
143
-
144
-
145
-
146
-
147
-
148
-
149
-
150
-
151
-
152
-
153
-
154
-
155
-
156
-
157
-
158
-
159
-
160
-
161
-
162
-
163
-
164
-
165
-
166
-
167
-
168
-
169
-
170
-
171
-
172
-
173
-
174
-
175
-
176
-
177
-
178
-
179
-
180
 |
 |

43CIGNA CORPORATION2011 Form10K
PART II
ITEM 7 Management’s Discussion and Analysis of Financial Condition and Results of Operations
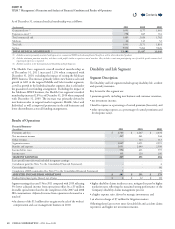
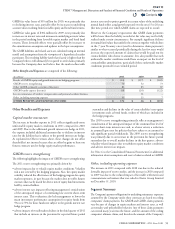
Balance Sheet Caption/Nature of Critical Accounting Estimate Eect if Dierent Assumptions Used
Accounts payable, accrued expenses and other liabilities – pension
liabilities
ese liabilities are estimates of the present value of the qualied and
nonqualied pension benets to be paid (attributed to employee service to
date) net of the fair value of plan assets. e accrued pension benet liability
as of December31 was as follows (inmillions):
•2011 – $1,769
•2010 – $1,528
See Note9 to the Consolidated Financial Statements for assumptions and
methods used to estimate pension liabilities.
Using past experience, the Company expects that it is reasonably possible
that a favorable or unfavorable change in assumptions for the discount
rate or expected return on plan assets of 50basis points could occur. An
unfavorable change is a decrease in these key assumptions with resulting
impacts as discussed below.
If discount rates for the qualied and nonqualied pension plans decreased
by 50basis points:
•annual pension costs for 2012 would decrease by approximately
$4million, after-tax; and
•the accrued pension benet liability would increase by approximately
$256million as of December31,2011 resulting in an after-tax
decrease to shareholders’ equity of approximately $166million as of
December31,2011.
If the expected long-term return on domestic qualied pension plan assets
decreased by 50basis points, annual pension costs for 2012 would increase
by approximately $11million after-tax.
If the Company used the market value of assets to measure pension costs as
opposed to the market-related value, annual pension cost for 2012 would
increase by approximately $11million after-tax.
If the December31,2011 fair values of domestic qualied plan assets
decreased by 10%, the accrued pension benet liability would increase by
approximately $328million as of December31,2011 resulting in an after-
tax decrease to shareholders’ equity of approximately $213million.
An increase in these key assumptions would result in impacts to annual
pension costs, the accrued pension liability and shareholders’ equity in an
opposite direction, but similar amounts.
Health Care medical claims payable
Medical claims payable for the Health Care segment include both reported
claims and estimates for losses incurred but not yet reported.
Liabilities for medical claims payable as of December31 were as follows
(inmillions):
•2011 – gross $1,095; net $901
•2010 – gross $1,246; net $1,010
ese liabilities are presented above both gross and net of reinsurance and
other recoverables and generally exclude amounts for administrative services
only business.
See Notes2 and 5 to the Consolidated Financial Statements for additional
information regarding assumptions and methods used to estimate this
liability.
In 2011, actual experience diered from the Company’s key assumptions
as of December31,2010, resulting in $126million of favorable incurred
claims related to prior years’ medical claims payable or 1.5% of the current
year incurred claims as reported in 2010. In 2010, actual experience diered
from the Company’s key assumptions as of December31,2009, resulting
in $93million of favorable incurred claims related to prior years’ medical
claims, or 1.3% of the current year incurred claims reported in 2009.
Specically, the favorable impact is due to faster than expected completion
factors and lower than expected medical cost trends, both of which included
an assumption for moderately adverse experience.
e impact of this favorable prior year development was an increase to
shareholders’ net income of $53million after-tax ($82million pre-tax) in
2011. e change in the amount of the incurred claims related to prior years
in the medical claims payable liability does not directly correspond to an
increase or decrease in shareholders’ net income as explained in Note5 to
the Consolidated Financial Statements.
Contents
Q