Cigna 2011 Annual Report Download - page 64
Download and view the complete annual report
Please find page 64 of the 2011 Cigna annual report below. You can navigate through the pages in the report by either clicking on the pages listed below, or by using the keyword search tool below to find specific information within the annual report.-
 1
1 -
2
-
3
-
4
-
5
-
6
-
7
-
8
-
9
-
10
-
11
-
12
-
13
-
14
-
15
-
16
-
17
-
18
-
19
-
20
-
21
-
22
-
23
-
24
-
25
-
26
-
27
-
28
-
29
-
30
-
31
-
32
-
33
-
34
-
35
-
36
-
37
-
38
-
39
-
40
-
41
-
42
-
43
-
44
-
45
-
46
-
47
-
48
-
49
-
50
-
51
-
52
-
53
-
 54
54 -
 55
55 -
 56
56 -
 57
57 -
 58
58 -
 59
59 -
 60
60 -
 61
61 -
 62
62 -
 63
63 -
 64
64 -
 65
65 -
 66
66 -
 67
67 -
 68
68 -
 69
69 -
 70
70 -
 71
71 -
 72
72 -
 73
73 -
 74
74 -
75
-
76
-
77
-
78
-
79
-
80
-
81
-
82
-
83
-
84
-
85
-
86
-
87
-
88
-
89
-
90
-
91
-
92
-
93
-
94
-
95
-
96
-
97
-
98
-
99
-
100
-
101
-
102
-
103
-
104
-
105
-
106
-
107
-
108
-
109
-
110
-
111
-
112
-
113
-
114
-
115
-
116
-
117
-
118
-
119
-
120
-
121
-
122
-
123
-
124
-
125
-
126
-
127
-
128
-
129
-
130
-
131
-
132
-
133
-
134
-
135
-
136
-
137
-
138
-
139
-
140
-
141
-
142
-
143
-
144
-
145
-
146
-
147
-
148
-
149
-
150
-
151
-
152
-
153
-
154
-
155
-
156
-
157
-
158
-
159
-
160
-
161
-
162
-
163
-
164
-
165
-
166
-
167
-
168
-
169
-
170
-
171
-
172
-
173
-
174
-
175
-
176
-
177
-
178
-
179
-
180
 |
 |

42 CIGNA CORPORATION2011 Form10K
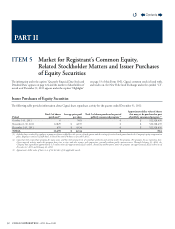
PART II
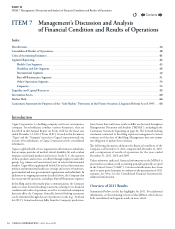
ITEM 7 Management’s Discussion and Analysis of Financial Condition and Results of Operations
Balance Sheet Caption/Nature of Critical Accounting Estimate Eect if Dierent Assumptions Used
Accounts payable, accrued expenses and other liabilities, and Other
assets, including other intangibles - Guaranteed minimum income
benets
ese net liabilities are calculated with an internal model using many
scenarios to determine the fair value of amounts estimated to be paid, less
the fair value of net future premiums estimated to be received, adjusted for
risk and prot charges that the Company anticipates a hypothetical market
participant would require to assume this business. e amounts estimated
to be paid represent the excess of the anticipated value of the income benet
over the value of the annuitants’ accounts at the time of annuitization.
e assets associated with these contracts represent receivables in connection
with reinsurance that the Company has purchased from two external
reinsurers, which covers 55% of the exposures on these contracts.
Liabilities related to these contracts as of December31, were as follows
(inmillions):
•2011 – $1,333
•2010 – $ 903
As of December31, estimated amounts receivable related to these contracts
from two external reinsurers, were as follows (inmillions):
•2011 – $712
•2010 – $480
Current assumptions and methods used to estimate these liabilities are
detailed in Note10 to the Consolidated Financial Statements.
e Company’s results of operations are expected to be volatile in future
periods because most capital market assumptions will be based largely on
market-observable inputs at the close of each period including interest rates
and market-implied volatilities.
Based on current and historical market, industry and Company-specic
experience and management’s judgment, the Company believes that it is
reasonably likely that the unfavorable changes in the key assumptions and/
or conditions described below could occur. If these unfavorable assumption
changes were to occur, the approximate after-tax decrease in shareholders’
net income, net of estimated amounts receivable from reinsurers, would be
as follows:
•50basis point decrease in interest rates (rates aligned with LIBOR) used
for projecting market returns and discounting, net of the impact of
hedging programs – $20million
•50basis point decrease in interest rates used for projecting claim exposure
(7-year Treasury rates) – $20million
•20% increase in volatility – $5million
•5% decrease in mortality – $1million
•10% increase in annuity election rates – $2million
•10% decrease in lapse rates – $5million
•10% increase to the risk and prot charges – $5million
Market declines expose the Company to a larger net liability. Decreases
in annuitants’ account values resulting from a 10% equity market decline
could decrease shareholders’ net income by approximately $15million, net
of the impact of hedging programs. Decreases in annuitants’ account values
resulting from a 3% decline due to bond/money market performance could
decrease shareholders’ net income by approximately $2million.
If credit default swap spreads used to evaluate the nonperformance risk
of the Company were to narrow or the credit rating of its principal life
insurance subsidiary were to improve, it would cause a decrease in the
discount rate of the GMIB liability, resulting in an unfavorable impact to
earnings. If the discount rate decreased by 25basis points due to this, the
decrease in shareholders’ net income would be approximately $15million.
If credit default swap spreads used to evaluate the nonperformance
risk of the Company’s GMIB retrocessionaires were to widen or the
retrocessionaires’ credit ratings were to weaken, it would cause an increase
in the discount rate of the GMIB asset, resulting in an unfavorable impact
to earnings. If the discount rate increased by 25basis points due to this, the
decrease in shareholders’ net income would be approximately $5million.
All of these estimated impacts due to unfavorable changes in assumptions
and/or conditions could vary from quarter to quarter depending on actual
reserve levels, the actual market conditions or changes in the anticipated
view of a hypothetical market participant as of any future valuation date.
e amounts would be reected in the Run-o Reinsurance segment.
Contents
Q