Cigna 2011 Annual Report Download - page 68
Download and view the complete annual report
Please find page 68 of the 2011 Cigna annual report below. You can navigate through the pages in the report by either clicking on the pages listed below, or by using the keyword search tool below to find specific information within the annual report.-
 1
1 -
2
-
3
-
4
-
5
-
6
-
7
-
8
-
9
-
10
-
11
-
12
-
13
-
14
-
15
-
16
-
17
-
18
-
19
-
20
-
21
-
22
-
23
-
24
-
25
-
26
-
27
-
28
-
29
-
30
-
31
-
32
-
33
-
34
-
35
-
36
-
37
-
38
-
39
-
40
-
41
-
42
-
43
-
44
-
45
-
46
-
47
-
48
-
49
-
50
-
51
-
52
-
53
-
54
-
55
-
56
-
57
-
 58
58 -
 59
59 -
 60
60 -
 61
61 -
 62
62 -
 63
63 -
 64
64 -
 65
65 -
 66
66 -
 67
67 -
 68
68 -
 69
69 -
 70
70 -
 71
71 -
 72
72 -
 73
73 -
 74
74 -
 75
75 -
 76
76 -
 77
77 -
 78
78 -
79
-
80
-
81
-
82
-
83
-
84
-
85
-
86
-
87
-
88
-
89
-
90
-
91
-
92
-
93
-
94
-
95
-
96
-
97
-
98
-
99
-
100
-
101
-
102
-
103
-
104
-
105
-
106
-
107
-
108
-
109
-
110
-
111
-
112
-
113
-
114
-
115
-
116
-
117
-
118
-
119
-
120
-
121
-
122
-
123
-
124
-
125
-
126
-
127
-
128
-
129
-
130
-
131
-
132
-
133
-
134
-
135
-
136
-
137
-
138
-
139
-
140
-
141
-
142
-
143
-
144
-
145
-
146
-
147
-
148
-
149
-
150
-
151
-
152
-
153
-
154
-
155
-
156
-
157
-
158
-
159
-
160
-
161
-
162
-
163
-
164
-
165
-
166
-
167
-
168
-
169
-
170
-
171
-
172
-
173
-
174
-
175
-
176
-
177
-
178
-
179
-
180
 |
 |

46 CIGNA CORPORATION2011 Form10K
PART II
ITEM 7 Management’s Discussion and Analysis of Financial Condition and Results of Operations
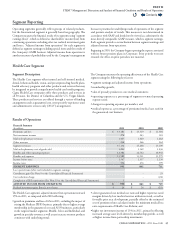
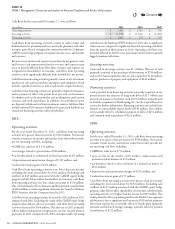
e Health Care segment’s adjustedincome from operations increased
18% in 2010, as compared with 2009 reecting:
•
revenue growth in the commercial risk businesses, particularly in
the targeted market segments, as evidenced by a 15% increase in
commercial risk membership. In addition, adjusted income from
operations was favorably impacted by increased penetration of the
Company’s specialty products;
•
a lower guaranteed cost medical care ratio driven by lower medical
cost trend, reecting lower utilization levels, as well as favorable prior
year development; and
•
higher investment income due to higher security partnership results,
higher real estate income and increased assets driven by membership
growth.
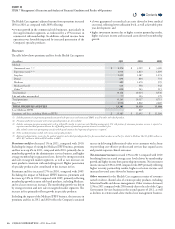
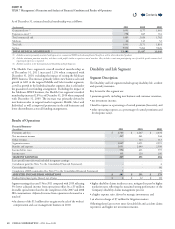
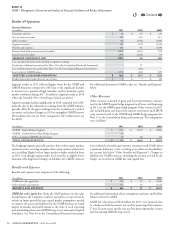
Revenues
e table below shows premiums and fees for the Health Care segment:
(In millions)
2011 2010 2009
Medical:
Guaranteed cost (1)(2) $ 4,176 $ 3,929 $ 3,380
Experience-rated(2)(3) 1,934 1,823 1,699
Stop loss 1,451 1,287 1,274
Dental 894 804 731
Medicare 489 1,470 595
Medicare PartD 624 558 342
Other(4) 600 543 515
Total medical 10,168 10,414 8,536
Life and other non-medical 77 103 179
Total premiums 10,245 10,517 8,715
Fees(2)(5) 2,936 2,802 2,669
TOTAL PREMIUMS AND FEES 13,181 13,319 11,384
Less: Medicare IPFFS - 827 -
Premiums and fees, excluding Medicare IPFFS $ 13,181 $ 12,492 $ 11,384
(1) Includes guaranteed cost premiums primarily associated with open access and commercial HMO, as well as other risk-related products.
(2) Premiums and/or fees associated with certain specialty products are also included.
(3) Includes minimum premium arrangements with a risk profile similar to experience-rated funding arrangements. The risk portion of minimum premium revenue is reported in
experience-rated medical premium whereas the self funding portion of minimum premium revenue is recorded in fees.
Also, includes certain non-participating cases for which special customer level reporting of experience is required.
(4) Other medical premiums include risk revenue and specialty products.
(5) Represents administrative service fees for medical members and related specialty product fees for non-medical members as well as fees related to Medicare PartD of $61million in
2011, $57million in 2010 and $41million in 2009.
Premiums and fees decreased 1% in 2011, compared with 2010.
Excluding the impact of exiting the Medicare IPFFS business, premiums
and fees were up 6% in 2011, compared with 2010, primarily due to
membership growth in the administrative services business, and higher
average membership in guaranteed cost, driven by strong retention
and sales in targeted market segments, as well as rate increases on
most products consistent with underlying trend. Higher penetration
of specialty products also contributed to the increase in fees.
Premiums and fees increased 17% in 2010, compared with 2009.
Excluding the impact of Medicare IPFFS business, premiums and
fees were up 10% in 2010 compared with 2009, primarily reecting
membership growth in most risk-based products, including Medicare,
and to a lesser extent rate increases. e membership growth was driven
by strong retention and new sales in targeted market segments. e
increase in fees primarily reects growth in specialty products.
Excluding the impact of the Medicare IPFFS business, the increases in
premiums and fees in 2011 and 2010 reect the Company’s sustained
success in delivering dierentiated value to its customers with a focus
on providing cost-eective products and services that expand access
and provide superior clinical outcomes.
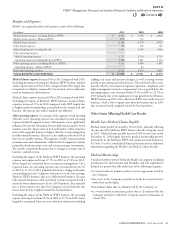
Net investment incomeincreased 13% in 2011 compared with 2010
beneting from increased average asset levels driven by membership
growth and higher income from partnership investments. Net investment
income increased 34% in 2010 compared with 2009 primarily reecting
higher security partnership results, higher real estate income and
increased invested assets driven by business growth.
Other revenues for the Health Care segment consist of revenues
earned on direct channel sales of certain specialty products, including
behavioral health and disease management. Other revenues decreased
12% in 2011 compared with 2010 mostly due to the sale of the Cigna
Government Services business in the second quarter of 2011, as well
as declines in certain stand-alone medical cost management business.
Contents
Q