Cigna 2011 Annual Report Download - page 76
Download and view the complete annual report
Please find page 76 of the 2011 Cigna annual report below. You can navigate through the pages in the report by either clicking on the pages listed below, or by using the keyword search tool below to find specific information within the annual report.
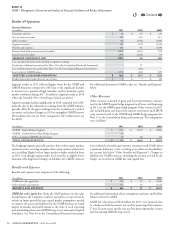
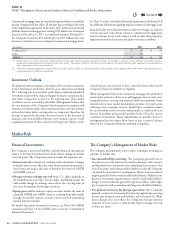
54 CIGNA CORPORATION2011 Form10K
PART II
ITEM 7 Management’s Discussion and Analysis of Financial Condition and Results of Operations
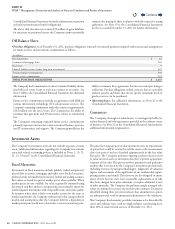
ultimate payment obligations and corresponding ultimate collection
from retrocessionaires may not be known with certainty for some time.
e Company’s reserves for underlying reinsurance exposures assumed by
the Company, as well as for amounts recoverable from retrocessionaires,
are considered appropriate as of December31,2011, based on current
information. However, it is possible that future developments, which
could include but are not limited to worse than expected claim experience
and higher than expected volatility, could have a material adverse eect
on the Company’s consolidated results of operations and nancial
condition. e Company bears the risk of loss if its payment obligations
to cedents increase or if its retrocessionaires are unable to meet, or
successfully challenge, their reinsurance obligations to the Company.
Other Operations Segment
Segment Description
Cigna’s Other Operations segment includes the results of the following
businesses:
•corporate-owned life insurance (“COLI”);
•
deferred gains recognized from the 1998 sale of the individual life
insurance and annuity business and the 2004 sale of the retirement
benets business; and
•run-o settlement annuity business.
COLI has contributed the majority of earnings in Other Operations
for the periods presented. e COLI regulatory environment continues
to evolve, with various federal budget related proposals recommending
changes in policyholder tax treatment. Although regulatory and
legislative activity could adversely impact our business and policyholders,
management does not expect the impact to materially aect the
Company’s results of operations, nancial condition or liquidity.
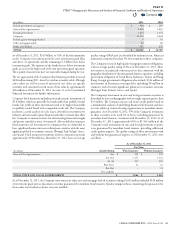
Results of Operations
Financial Summary
(In millions)
2011 2010 2009
Premiums and fees $ 114 $ 114 $ 112
Net investment income 400 404 407
Other revenues 55 60 64
Segment revenues 569 578 583
Benets and expenses 451 454 466
Income before taxes 118 124 117
Income taxes 29 39 31
SEGMENT EARNINGS 89 85 86
Completion of IRS examination (See Note19 to the Consolidated Financial Statements) 4 - 1
ADJUSTED INCOME FROM OPERATIONS $ 85 $ 85 $ 85
Realized investment gains (losses), net of taxes $ 6 $ 5 $ (6)
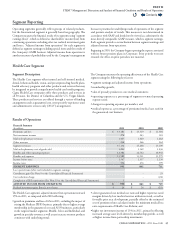
Segment earnings increased in 2011 compared with 2010, reecting a
$4million increase to earnings due to the completion of the Company’s
2007 and 2008 IRS examination during the rst quarter of 2011.
Adjusted income from operations were at in 2011 compared with
2010, reecting higher COLI earnings due to higher interest margins,
oset by lower earnings associated with the sold businesses due to the
continued decline in deferred gain amortization.
Segment earnings and adjusted income from operations were at in
2010 compared with 2009, reecting an increase in COLI earnings
driven by higher investment income and favorable mortality, primarily
oset by the continued decline in deferred gain amortization associated
with the sold businesses.
Revenues
Premiums and fees reect fees charged primarily on universal life
insurance policies in the COLI business. Such amounts were relatively
at reecting a stable block of business.
Net investment income decreased 1% in 2011 compared with 2010,
and decreased 1% in 2010 compared with 2009 due to lower portfolio
yields partially oset by higher average invested assets.
Other revenues decreased 8% in 2011 compared with 2010 and
decreased 6% in 2010 compared with 2009 primarily due to lower
deferred gain amortization related to the sold retirement benets and
individual life insurance and annuity businesses.
For more information regarding the sale of these businesses see Note7
of the Consolidated Financial Statements beginning on page84 of
this Form10-K.
Corporate
Description
Corporate reects amounts not allocated to other segments, such as net
interest expense (dened as interest on corporate debt less net investment
income on investments not supporting segment operations), interest
on uncertain tax positions, certain litigation matters, intersegment
eliminations, compensation cost for stock options and certain corporate
overhead expenses such as directors’ expenses and, beginning in 2010,
pension expense related to the Company’s frozen pension plans.
Contents
Q


