Cigna 2011 Annual Report Download - page 84
Download and view the complete annual report
Please find page 84 of the 2011 Cigna annual report below. You can navigate through the pages in the report by either clicking on the pages listed below, or by using the keyword search tool below to find specific information within the annual report.-
 1
1 -
2
-
3
-
4
-
5
-
6
-
7
-
8
-
9
-
10
-
11
-
12
-
13
-
14
-
15
-
16
-
17
-
18
-
19
-
20
-
21
-
22
-
23
-
24
-
25
-
26
-
27
-
28
-
29
-
30
-
31
-
32
-
33
-
34
-
35
-
36
-
37
-
38
-
39
-
40
-
41
-
42
-
43
-
44
-
45
-
46
-
47
-
48
-
49
-
50
-
51
-
52
-
53
-
54
-
55
-
56
-
57
-
58
-
59
-
60
-
61
-
62
-
63
-
64
-
65
-
66
-
67
-
68
-
69
-
70
-
71
-
72
-
73
-
 74
74 -
 75
75 -
 76
76 -
 77
77 -
 78
78 -
 79
79 -
 80
80 -
 81
81 -
 82
82 -
 83
83 -
 84
84 -
 85
85 -
 86
86 -
 87
87 -
 88
88 -
 89
89 -
 90
90 -
 91
91 -
 92
92 -
 93
93 -
 94
94 -
95
-
96
-
97
-
98
-
99
-
100
-
101
-
102
-
103
-
104
-
105
-
106
-
107
-
108
-
109
-
110
-
111
-
112
-
113
-
114
-
115
-
116
-
117
-
118
-
119
-
120
-
121
-
122
-
123
-
124
-
125
-
126
-
127
-
128
-
129
-
130
-
131
-
132
-
133
-
134
-
135
-
136
-
137
-
138
-
139
-
140
-
141
-
142
-
143
-
144
-
145
-
146
-
147
-
148
-
149
-
150
-
151
-
152
-
153
-
154
-
155
-
156
-
157
-
158
-
159
-
160
-
161
-
162
-
163
-
164
-
165
-
166
-
167
-
168
-
169
-
170
-
171
-
172
-
173
-
174
-
175
-
176
-
177
-
178
-
179
-
180
 |
 |

62 CIGNA CORPORATION2011 Form10K
PART II
ITEM 7 Management’s Discussion and Analysis of Financial Condition and Results of Operations
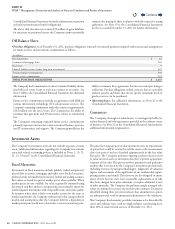
As of December31,2011, the Company had no direct investments in monoline bond insurers. Guarantees provided by various monoline bond
insurers for certain of the Company’s investments in state and local governments and other asset-backed securities as of December31,2011 were:
Guarantor
(In millions)
As of December31,2011
Indirect Exposure
National Public Finance Guarantee $ 1,261
Assured Guaranty Municipal Corp 610
AMBAC 174
Financial Guaranty Insurance Co. 39
TOTAL $ 2,084
Commercial Mortgage Loans
e Company’s commercial mortgage loans are xed rate loans,
diversied by property type, location and borrower to reduce exposure
to potential losses. Loans are secured by high quality commercial
properties and are generally made at less than 75% of the property’s
value at origination of the loan. In addition to property value, debt
service coverage, building tenancy and stability of cash ows are all
important nancial underwriting considerations. Property type, location,
quality, and borrower are all important underwriting considerations
as well. e Company holds no direct residential mortgage loans and
does not securitize or service mortgage loans.
e Company completed its annual in depth review of its commercial
mortgage loan portfolio during the second quarter of 2011. is review
included an analysis of each property’s year-end 2010 nancial statements,
rent rolls, operating plans and budgets for 2011, a physical inspection of
the property and other pertinent factors. Based on property values and
cash ows estimated as part of this review, and considering updates for
loans where material changes were subsequently identied, the overall
health of the portfolio improved from 2010, consistent with recovery
in many of the commercial real estate markets.
Based on this review and subsequent portfolio activity, the average
loan-to-value ratio improved to 70% and the debt service coverage ratio
was estimated to be 1.40 at December31,2011. e average loan-to-
value ratio decreased from 74% as of December31,2010, and the debt
service coverage ratio increased from 1.38 as of December31,2010.
e decrease in average loan-to-value ratio generally reects increased
valuations for the majority of the underlying properties. Valuation
changes varied by property type as apartments and hotels demonstrated
the strongest recovery, retail and oce properties showed modest
improvement and industrial properties exhibited a slight decline. e
slight increase in debt service coverage ratio reects greater demand
for apartments and hotels, partially oset by slower recovery in leasing
rates on industrial properties and ongoing portfolio activity.
Commercial real estate capital markets remain most active for well
leased, quality commercial real estate located in strong institutional
investment markets. e vast majority of properties securing the
mortgages in Cigna’s mortgage portfolio possess these characteristics.
While commercial real estate fundamentals continued to improve in
2011, the improvement has varied across geographies and property
types. A broad recovery is dependent on continued improvement in
the national economy.
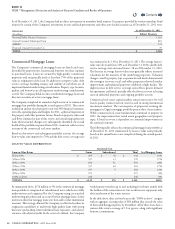
e following table reects the commercial mortgage loan portfolio as
of December31,2011 summarized by loan-to-value ratio primarily
based on the annual loan review completed during the second quarter
of 2011.
LOANTOVALUE DISTRIBUTION
Loan-to-Value Ratios
Amortized Cost
% of Mortgage LoansSenior Subordinated Total
Below 50% $ 299 $ 43 $ 342 10%
50% to 59% 537 33 570 17%
60% to 69% 854 51 905 28%
70% to 79% 517 44 561 17%
80% to 89% 397 5 402 12%
90% to 99% 275 - 275 8%
100% or above 246 - 246 8%
TOTALS $ 3,125 $ 176 $ 3,301 100%
As summarized above, $176million or 5% of the commercial mortgage
loan portfolio is comprised of subordinated notes which were fully
underwritten and originated by the Company using its standard
underwriting procedures and are secured by rst mortgage loans. Senior
interests in these rst mortgage loans were then sold to other institutional
investors. is strategy allowed the Company to eectively utilize its
origination capabilities to underwrite high quality loans with strong
borrower sponsorship, limit individual loan exposures, and achieve
attractive risk adjusted yields. In the event of a default, the Company
would pursue remedies up to and including foreclosure jointly with
the holders of the senior interests, but would receive repayment only
after satisfaction of the senior interest.
In the table above, there are four loans in the “100% or above” category
with an aggregate carrying value of $84million that exceeds the value
of their underlying properties by $6million. All of these loans have a
current debt service coverage of 1.0 or greater, along with signicant
borrower commitment.
Contents
Q