Cigna 2011 Annual Report Download - page 71
Download and view the complete annual report
Please find page 71 of the 2011 Cigna annual report below. You can navigate through the pages in the report by either clicking on the pages listed below, or by using the keyword search tool below to find specific information within the annual report.-
 1
1 -
2
-
3
-
4
-
5
-
6
-
7
-
8
-
9
-
10
-
11
-
12
-
13
-
14
-
15
-
16
-
17
-
18
-
19
-
20
-
21
-
22
-
23
-
24
-
25
-
26
-
27
-
28
-
29
-
30
-
31
-
32
-
33
-
34
-
35
-
36
-
37
-
38
-
39
-
40
-
41
-
42
-
43
-
44
-
45
-
46
-
47
-
48
-
49
-
50
-
51
-
52
-
53
-
54
-
55
-
56
-
57
-
58
-
59
-
60
-
 61
61 -
 62
62 -
 63
63 -
 64
64 -
 65
65 -
 66
66 -
 67
67 -
 68
68 -
 69
69 -
 70
70 -
 71
71 -
 72
72 -
 73
73 -
 74
74 -
 75
75 -
 76
76 -
 77
77 -
 78
78 -
 79
79 -
 80
80 -
 81
81 -
82
-
83
-
84
-
85
-
86
-
87
-
88
-
89
-
90
-
91
-
92
-
93
-
94
-
95
-
96
-
97
-
98
-
99
-
100
-
101
-
102
-
103
-
104
-
105
-
106
-
107
-
108
-
109
-
110
-
111
-
112
-
113
-
114
-
115
-
116
-
117
-
118
-
119
-
120
-
121
-
122
-
123
-
124
-
125
-
126
-
127
-
128
-
129
-
130
-
131
-
132
-
133
-
134
-
135
-
136
-
137
-
138
-
139
-
140
-
141
-
142
-
143
-
144
-
145
-
146
-
147
-
148
-
149
-
150
-
151
-
152
-
153
-
154
-
155
-
156
-
157
-
158
-
159
-
160
-
161
-
162
-
163
-
164
-
165
-
166
-
167
-
168
-
169
-
170
-
171
-
172
-
173
-
174
-
175
-
176
-
177
-
178
-
179
-
180
 |
 |

49CIGNA CORPORATION2011 Form10K
PART II
ITEM 7 Management’s Discussion and Analysis of Financial Condition and Results of Operations
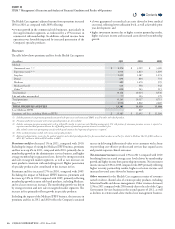
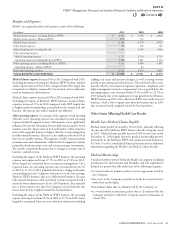
Segment earnings increased 2% in 2010 compared to 2009 reecting
4% higher adjusted income from operations partially oset by the
absence of a $5million favorable special item related to the completion
of the 2005 and 2006 IRS examinations. Adjusted income from
operations increased as a result of higher net investment income and
the $11million after-tax gain on the sale of the workers’ compensation
and case management business.
Largely osetting these factors were:
•less favorable claims experience in the disability insurance business,
primarily related to lower short-term disability underwriting margins.
ese results include the favorable after-tax impact of disability reserve
studies of $29million in 2010 compared with $20million in 2009,
which reect continued strong disability claims management programs;
•
slightly less favorable accident claims experience including the less
favorable after-tax impact of reserve studies of $3million in 2010
compared with $5million in 2009; and
•
lower earnings in specialty products largely due to the sale of the
student and participant accident business.
Revenues
Premiums and fees increased 4% in 2011 compared with 2010 reecting
disability and life sales growth and continued solid persistency partially
oset by the impact of the Company’s exit from a large, low-margin
assumed government life insurance program. Excluding the impact
of this item, premiums and fees increased 6%. Disability premiums
and fees grew by 9%.
Premiums and fees increased 1% in 2010 compared with 2009 as a
result of disability and life sales growth combined with solid persistency,
largely oset by the Company’s exit from two large, non-strategic
assumed government life insurance programs and the sale of the renewal
rights for the student and participant accident business. Excluding the
impact of these items, premiums and fees increased 7%.
Net investment income increased 2% in 2011 compared with 2010
due to higher average assets reecting business growth and higher
prepayment fees partially oset by lower yields. Net investment income
increased by 7% in 2010 reecting higher income from security and
real estate partnerships and higher assets.
Other revenues. e absence of other revenues in 2011 reects the
sale of the workers’ compensation and case management business that
was completed during the fourth quarter of 2010. Other revenues in
2010 include the $18million pre-tax gain on the sale of the workers’
compensation and case management business in 2010.
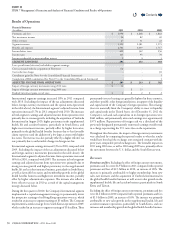
Benefits and Expenses
Benets and expenses were essentially at in 2011 as compared with
2010 reecting disability and life business growth, less favorable
disability claims experience and a higher operating expense ratio,
largely oset by the absence of operating expenses associated with the
workers’ compensation and case management business that was sold
in 2010 and favorable life and accident claims experience. Benets and
expenses include the favorable before tax impact of reserve studies of
$59million in 2011 as compared with $55million in 2010.
Benets and expenses increased 2% in 2010 compared with 2009,
primarily reecting disability and life business growth and less favorable
short-term disability claims experience. Benets and expenses include the
favorable before tax impact of disability reserve studies of $43million
in 2010 as compared with $29million in 2009, largely driven by
continued strong disability claims management programs. ese factors
were partially oset by the Company’s exit from two large, non-strategic
assumed government life insurance programs and the sale of the renewal
rights for the student and participant accident business.
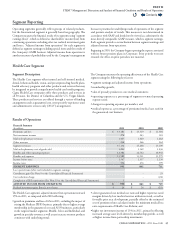
International Segment
Segment Description
e International segment includes supplemental health, life and
accident insurance products and international health care products
and services, including those oered to individuals and globally mobile
employees of multinational corporations and organizations.
e key factors for this segment are:
•premium growth, including new business and customer retention;
•benets expense as a percentage of earned premium (loss ratio);
•
operating expense as a percentage of earned premium (expense
ratio); and
•impact of foreign currency movements.
Contents
Q