Cigna 2011 Annual Report Download - page 121
Download and view the complete annual report
Please find page 121 of the 2011 Cigna annual report below. You can navigate through the pages in the report by either clicking on the pages listed below, or by using the keyword search tool below to find specific information within the annual report.-
 1
1 -
2
-
3
-
4
-
5
-
6
-
7
-
8
-
9
-
10
-
11
-
12
-
13
-
14
-
15
-
16
-
17
-
18
-
19
-
20
-
21
-
22
-
23
-
24
-
25
-
26
-
27
-
28
-
29
-
30
-
31
-
32
-
33
-
34
-
35
-
36
-
37
-
38
-
39
-
40
-
41
-
42
-
43
-
44
-
45
-
46
-
47
-
48
-
49
-
50
-
51
-
52
-
53
-
54
-
55
-
56
-
57
-
58
-
59
-
60
-
61
-
62
-
63
-
64
-
65
-
66
-
67
-
68
-
69
-
70
-
71
-
72
-
73
-
74
-
75
-
76
-
77
-
78
-
79
-
80
-
81
-
82
-
83
-
84
-
85
-
86
-
87
-
88
-
89
-
90
-
91
-
92
-
93
-
94
-
95
-
96
-
97
-
98
-
99
-
100
-
101
-
102
-
103
-
104
-
105
-
106
-
107
-
108
-
109
-
110
-
 111
111 -
 112
112 -
 113
113 -
 114
114 -
 115
115 -
 116
116 -
 117
117 -
 118
118 -
 119
119 -
 120
120 -
 121
121 -
 122
122 -
 123
123 -
 124
124 -
 125
125 -
 126
126 -
 127
127 -
 128
128 -
 129
129 -
 130
130 -
 131
131 -
132
-
133
-
134
-
135
-
136
-
137
-
138
-
139
-
140
-
141
-
142
-
143
-
144
-
145
-
146
-
147
-
148
-
149
-
150
-
151
-
152
-
153
-
154
-
155
-
156
-
157
-
158
-
159
-
160
-
161
-
162
-
163
-
164
-
165
-
166
-
167
-
168
-
169
-
170
-
171
-
172
-
173
-
174
-
175
-
176
-
177
-
178
-
179
-
180
 |
 |
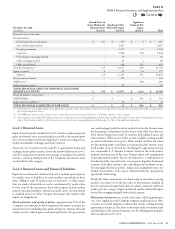
99CIGNA CORPORATION2011 Form10K
PART II
ITEM 8 Financial Statements and Supplementary Data
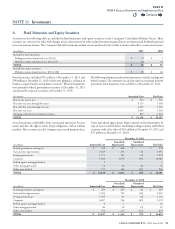
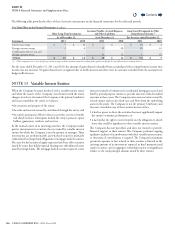
NOTE 11 Investments
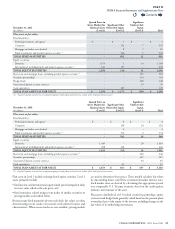
A. Fixed Maturities and Equity Securities
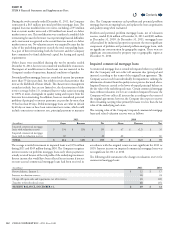
Securities in the following table are included in xed maturities and equity securities on the Company’s Consolidated Balance Sheets. ese
securities are carried at fair value with changes in fair value reported in other realized investment gains (losses) and interest and dividends reported
in net investment income. e Company’s hybrid investments include certain preferred stock or debt securities with call or conversion features.
(In millions)
2011 2010
Included in xed maturities:
Trading securities (amortized cost: $2; $3) $ 2 $ 3
Hybrid securities (amortized cost: $26; $45) 28 52
TOTAL $ 30 $ 55
Included in equity securities:
Hybrid securities (amortized cost: $90; $108) $ 65 $ 86
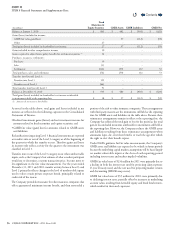
Fixed maturities included $79million at December31,2011 and
$98million at December31,2010, which were pledged as collateral to
brokers as required under certain futures contracts. ese xed maturities
were primarily federal government securities at December31,2011
and primarily corporate securities at December31,2010.
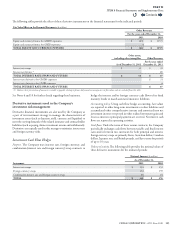
e following information about xed maturities excludes trading and
hybrid securities. e amortized cost and fair value by contractual maturity
periods for xed maturities were as follows at December31,2011:
(In millions)
Amortized Cost Fair Value
Due in one year or less $ 955 $ 967
Due after one year through ve years 4,719 5,060
Due after ve years through ten years 4,997 5,581
Due after ten years 2,699 3,565
Mortgage and other asset-backed securities 859 1,014
TOTAL $ 14,229 $ 16,187
Actual maturities could dier from contractual maturities because
issuers may have the right to call or prepay obligations, with or without
penalties. Also, in some cases the Company may extend maturity dates.
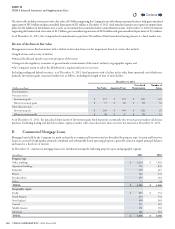
Gross unrealized appreciation (depreciation) on xed maturities by
type of issuer is shown below (excluding trading securities and hybrid
securities with a fair value of $30million at December31,2011 and
$55million at December31,2010).
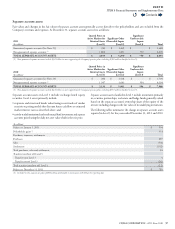
(In millions)
Amortized Cost
December31,2011
Unrealized
Appreciation
Unrealized
Depreciation Fair Value
Federal government and agency $ 552 $ 406 $ - $ 958
State and local government 2,185 274 (3) 2,456
Foreign government 1,173 103 (2) 1,274
Corporate 9,460 1,070 (45) 10,485
Federal agency mortgage-backed 9 - - 9
Other mortgage-backed 73 10 (4) 79
Other asset-backed 777 160 (11) 926
TOTAL $ 14,229 $ 2,023 $ 65 $ 16,187
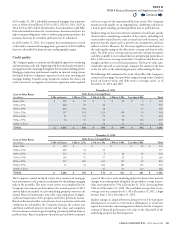
(In millions)
Amortized Cost
December31,2010
Unrealized
Appreciation
Unrealized
Depreciation Fair Value
Federal government and agency $ 459 $ 229 $ (1) $ 687
State and local government 2,305 172 (10) 2,467
Foreign government 1,095 63 (4) 1,154
Corporate 8,697 744 (49) 9,392
Federal agency mortgage-backed 9 1 - 10
Other mortgage-backed 80 10 (3) 87
Other asset-backed 752 117 (12) 857
TOTAL $ 13,397 $ 1,336 $ 79 $ 14,654
Contents
Q