Cigna 2011 Annual Report Download - page 125
Download and view the complete annual report
Please find page 125 of the 2011 Cigna annual report below. You can navigate through the pages in the report by either clicking on the pages listed below, or by using the keyword search tool below to find specific information within the annual report.
103CIGNA CORPORATION2011 Form10K
PART II
ITEM 8 Financial Statements and Supplementary Data
C. Real Estate
As of December31,2011 and 2010, real estate investments consisted primarily of oce and industrial buildings in California. Investments
with a carrying value of $49million as of December31,2011 and 2010 were non-income producing during the preceding twelve months. As
of December31,2011, the Company had commitments to contribute additional equity of $9million to real estate investments.
D. Other Long-Term Investments
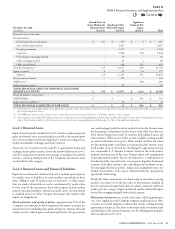
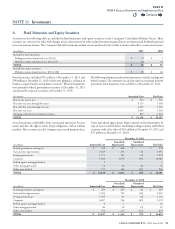
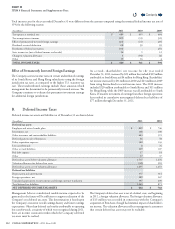
As of December31, other long-term investments consisted of the following:
(In millions)
2011 2010
Real estate entities $ 665 $ 394
Securities partnerships 298 288
Interest rate and foreign currency swaps 12 19
Mezzanine loans 31 13
Other 52 45
TOTAL $ 1,058 $ 759
Investments in real estate entities and securities partnerships with a
carrying value of $171million at December31,2011 and $169million
at December31,2010 were non-income producing during the preceding
twelve months.
As of December31,2011, the Company had commitments to contribute:
•
$165million to limited liability entities that hold either real estate
or loans to real estate entities that are diversied by property type
and geographic region; and
•
$242million to entities that hold securities diversied by issuer and
maturity date.
e Company expects to disburse approximately 50% of the committed
amounts in 2012.
E. Short-Term Investments and Cash
Equivalents
Short-term investments and cash equivalents included corporate
securities of $4.1billion, federal government securities of $164million
and money market funds of $40million as of December31,2011.
e Company’s short-term investments and cash equivalents as of
December31,2010 included corporate securities of $1.1billion,
federal government securities of $137million and money market
funds of $40million. e increase during 2011 is primarily due to
proceeds from the Company’s debt and equity issuances that were
used to partially fund the HealthSpring acquisition. See Note3 for
further information.
F. Concentration of Risk
As of December31,2011 and 2010, the Company did not have a concentration of investments in a single issuer or borrower exceeding 10%
of shareholders’ equity.
NOTE 12 Derivative Financial Instruments
e Company has written and purchased reinsurance contracts under
its run-o reinsurance segment that are accounted for as free standing
derivatives. e Company also uses derivative nancial instruments
to manage the equity, foreign currency, and certain interest rate risk
exposures of its run-o reinsurance segment. In addition, the Company
uses derivative nancial instruments to manage the characteristics of
investment assets to meet the varying demands of the related insurance
and contractholder liabilities. See Note2 for information on the
Company’s accounting policy for derivative nancial instruments.
Derivatives in the Company’s separate accounts are excluded from
the following discussion because associated gains and losses generally
accrue directly to separate account policyholders.
Collateral and termination features. e Company routinely monitors
exposure to credit risk associated with derivatives and diversies the
portfolio among approved dealers of high credit quality to minimize this
risk. Certain of the Company’s over-the-counter derivative instruments
contain provisions requiring either the Company or the counterparty
to post collateral or demand immediate payment depending on the
amount of the net liability position and predened nancial strength
or credit rating thresholds. Collateral posting requirements vary by
counterparty. e net liability positions of these derivatives were not
material as of December31,2011 or 2010.
Derivative instruments associated with the Company’s
run-off reinsurance segment
Guaranteed Minimum Income Benefits (GMIB)
Purpose. e Company has written reinsurance contracts with issuers
of variable annuity contracts that provide annuitants with certain
guarantees of minimum income benets resulting from the level of
variable annuity account values compared with a contractually guaranteed
amount (“GMIB liabilities”). According to the contractual terms of the
written reinsurance contracts, payment by the Company depends on
Contents
Q


