Cigna 2011 Annual Report Download - page 70
Download and view the complete annual report
Please find page 70 of the 2011 Cigna annual report below. You can navigate through the pages in the report by either clicking on the pages listed below, or by using the keyword search tool below to find specific information within the annual report.-
 1
1 -
2
-
3
-
4
-
5
-
6
-
7
-
8
-
9
-
10
-
11
-
12
-
13
-
14
-
15
-
16
-
17
-
18
-
19
-
20
-
21
-
22
-
23
-
24
-
25
-
26
-
27
-
28
-
29
-
30
-
31
-
32
-
33
-
34
-
35
-
36
-
37
-
38
-
39
-
40
-
41
-
42
-
43
-
44
-
45
-
46
-
47
-
48
-
49
-
50
-
51
-
52
-
53
-
54
-
55
-
56
-
57
-
58
-
59
-
 60
60 -
 61
61 -
 62
62 -
 63
63 -
 64
64 -
 65
65 -
 66
66 -
 67
67 -
 68
68 -
 69
69 -
 70
70 -
 71
71 -
 72
72 -
 73
73 -
 74
74 -
 75
75 -
 76
76 -
 77
77 -
 78
78 -
 79
79 -
 80
80 -
81
-
82
-
83
-
84
-
85
-
86
-
87
-
88
-
89
-
90
-
91
-
92
-
93
-
94
-
95
-
96
-
97
-
98
-
99
-
100
-
101
-
102
-
103
-
104
-
105
-
106
-
107
-
108
-
109
-
110
-
111
-
112
-
113
-
114
-
115
-
116
-
117
-
118
-
119
-
120
-
121
-
122
-
123
-
124
-
125
-
126
-
127
-
128
-
129
-
130
-
131
-
132
-
133
-
134
-
135
-
136
-
137
-
138
-
139
-
140
-
141
-
142
-
143
-
144
-
145
-
146
-
147
-
148
-
149
-
150
-
151
-
152
-
153
-
154
-
155
-
156
-
157
-
158
-
159
-
160
-
161
-
162
-
163
-
164
-
165
-
166
-
167
-
168
-
169
-
170
-
171
-
172
-
173
-
174
-
175
-
176
-
177
-
178
-
179
-
180
 |
 |

48 CIGNA CORPORATION2011 Form10K
PART II
ITEM 7 Management’s Discussion and Analysis of Financial Condition and Results of Operations
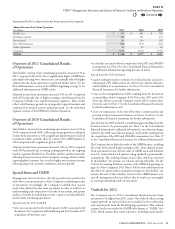
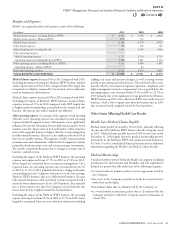
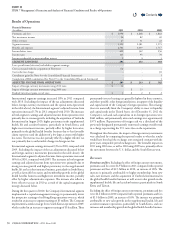
As of December31, estimated medical membership was as follows:
(In thousands)
2011 2010 2009
Guaranteed cost(1) 1,091 1,177 1,001
Experience-rated(2) 798 849 761
Total commercial risk 1,889 2,026 1,762
Medicare 44 145 52
Total risk 1,933 2,171 1,814
Service 9,550 9,266 9,226
TOTAL MEDICAL MEMBERSHIP3 11,483 11,437 11,040
(1) Includes members primarily associated with open access, commercial HMO and voluntary/limited benefits as well as other risk-related products.
(2) Includes minimum premium members, who have a risk profile similar to experience-rated members. Also, includes certain non-participating cases for which special customer level
reporting of experience is required.
(3) Excludes members in the International and Disability and Life Segments.
The Health Care segment’s overall medical membership as
of December31,2011 increased 1.2% when compared with
December31,2010, excluding the impact of exiting the Medicare
IPFFS business. is increase primarily reects new business sales and
growth in ASO in the targeted Middle and Select market segments,
as well as growth in the Individual market segment, that is sold under
the guaranteed cost funding arrangement. Excluding the impact of
the Medicare IPFFS business, the Health Care segment’s medical
membership increased 2.8% as of December31,2010 when compared
with December31,2009. e increase was primarily driven by
new business sales in targeted market segments: Middle, Select and
Individual, as well as improved persistency in the risk businesses and
lower disenrollment across all funding arrangements.
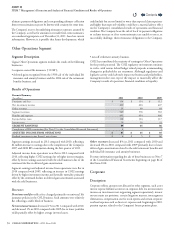
Disability and Life Segment
Segment Description
e Disability and Life segment includes group disability, life, accident
and specialty insurance.
Key factors for this segment are:
•premium growth, including new business and customer retention;
•net investment income;
•
benets expense as a percentage of earned premium (loss ratio); and
•
other operating expense as a percentage of earned premiums and
fees (expense ratio).
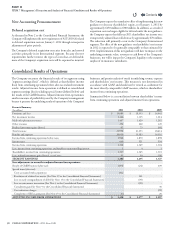
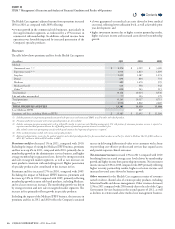
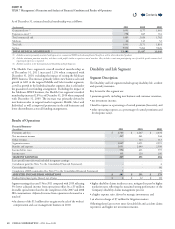
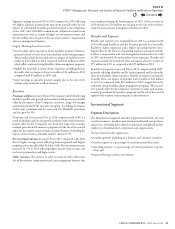
Results of Operations
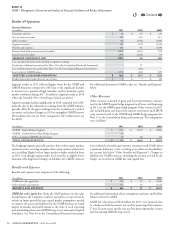
Financial Summary
(In millions)
2011 2010 2009
Premiums and fees $ 2,780 $ 2,667 $ 2,634
Net investment income 267 261 244
Other revenues - 123 113
Segment revenues 3,047 3,051 2,991
Benets and expenses 2,651 2,640 2,598
Income before taxes 396 411 393
Income taxes 109 120 109
SEGMENT EARNINGS 287 291 284
Less: special items (after-tax) included in segment earnings:
Curtailment gain (See Note9 to the Consolidated Financial Statements) - - 4
Cost reduction charge - - (4)
Completion of IRS examination (See Note19 to the Consolidated Financial Statements) 5 - 5
ADJUSTED INCOME FROM OPERATIONS $ 282 $ 291 $ 279
Realized investment gains (losses), net of taxes $ 6 $ 12 $ (1)
Segment earnings decreased 1% in 2011 compared with 2010 reecting
3% lower adjusted income from operations oset by a $5million
favorable special item related to the completion of the 2007 and 2008
IRS examinations. Adjusted income from operations decreased as a
result of:
•
the absence of the $11million after-tax gain on the sale of the workers’
compensation and case management business in 2010;
•higher disability claims incidence rates, mitigated in part by higher
resolution rates reecting the sustained strong performance of the
Company’s disability claims management process;
•a higher expense ratio, driven by strategic investments; and
•an after-tax charge of $7million for litigation matters.
Osetting these factors were more favorable life and accident claims
experience and higher net investment income.
Contents
Q