Cigna 2011 Annual Report Download - page 163
Download and view the complete annual report
Please find page 163 of the 2011 Cigna annual report below. You can navigate through the pages in the report by either clicking on the pages listed below, or by using the keyword search tool below to find specific information within the annual report.-
 1
1 -
2
-
3
-
4
-
5
-
6
-
7
-
8
-
9
-
10
-
11
-
12
-
13
-
14
-
15
-
16
-
17
-
18
-
19
-
20
-
21
-
22
-
23
-
24
-
25
-
26
-
27
-
28
-
29
-
30
-
31
-
32
-
33
-
34
-
35
-
36
-
37
-
38
-
39
-
40
-
41
-
42
-
43
-
44
-
45
-
46
-
47
-
48
-
49
-
50
-
51
-
52
-
53
-
54
-
55
-
56
-
57
-
58
-
59
-
60
-
61
-
62
-
63
-
64
-
65
-
66
-
67
-
68
-
69
-
70
-
71
-
72
-
73
-
74
-
75
-
76
-
77
-
78
-
79
-
80
-
81
-
82
-
83
-
84
-
85
-
86
-
87
-
88
-
89
-
90
-
91
-
92
-
93
-
94
-
95
-
96
-
97
-
98
-
99
-
100
-
101
-
102
-
103
-
104
-
105
-
106
-
107
-
108
-
109
-
110
-
111
-
112
-
113
-
114
-
115
-
116
-
117
-
118
-
119
-
120
-
121
-
122
-
123
-
124
-
125
-
126
-
127
-
128
-
129
-
130
-
131
-
132
-
133
-
134
-
135
-
136
-
137
-
138
-
139
-
140
-
141
-
142
-
143
-
144
-
145
-
146
-
147
-
148
-
149
-
150
-
151
-
152
-
 153
153 -
 154
154 -
 155
155 -
 156
156 -
 157
157 -
 158
158 -
 159
159 -
 160
160 -
 161
161 -
 162
162 -
 163
163 -
 164
164 -
 165
165 -
 166
166 -
 167
167 -
 168
168 -
 169
169 -
 170
170 -
 171
171 -
 172
172 -
 173
173 -
174
-
175
-
176
-
177
-
178
-
179
-
180
 |
 |

FS-11CIGNA CORPORATION2011 Form10K
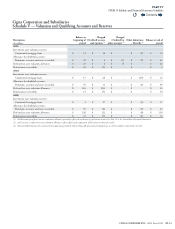
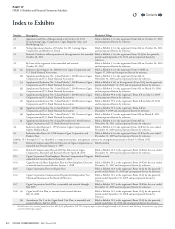
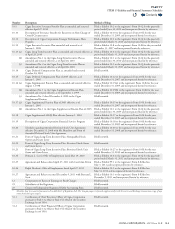
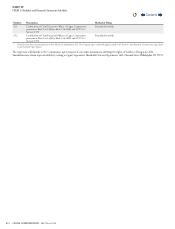
ITEM 15 Exhibits and Financial Statement Schedules
PART IV
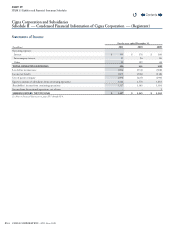
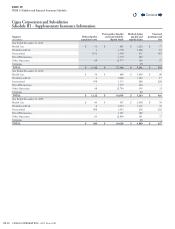
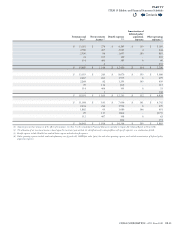
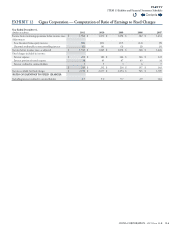
Premiums and
fees(1)
Net investment
income(2)
Benet expenses
(1)(3)
Amortization of
deferred policy
acquisition
expenses
Other operating
expenses(4)
$ 13,181 $ 274 $ 8,265 $ 139 $ 5,185
2,780 267 2,003 4 644
2,990 96 1,697 185 819
24 103 140 - 265
114 400 385 6 60
- 6 - - 233
$ 19,089 $ 1,146 $ 12,490 $ 334 $ 7,206
$ 13,319 $ 243 $ 8,670 $ 155 $ 5,086
2,667 261 1,935 6 699
2,268 82 1,255 145 639
25 114 (22) - 113
114 404 395 6 53
- 1 - - 248
$ 18,393 $ 1,105 $ 12,233 $ 312 $ 6,838
$ 11,384 $ 181 $ 7,096 $ 141 $ 4,742
2,634 244 1,922 6 670
1,882 69 1,080 146 491
29 113 (146) - (273)
112 407 398 6 62
- - (16) - 191
$ 16,041 $ 1,014 $ 10,334 $ 299 $ 5,883
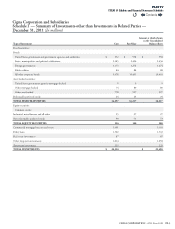
(1) Amounts presented are shown net of the effects of reinsurance. See Note7 to the Consolidated Financial Statements included in Cigna’s 2011 Annual Report on Form10-K.
(2) The allocation of net investment income is based upon the investment year method, the identification of certain portfolios with specific segments, or a combination of both.
(3) Benefit expenses include Health Care medical claims expense and other benefit expenses.
(4) Other operating expenses include mail order pharmacy cost of goods sold, GMIB fair value (gain) loss and other operating expenses, and excludes amortization of deferred policy
acquisition expenses.
Contents
Q