WeightWatchers 2011 Annual Report Download - page 93
Download and view the complete annual report
Please find page 93 of the 2011 WeightWatchers annual report below. You can navigate through the pages in the report by either clicking on the pages listed below, or by using the keyword search tool below to find specific information within the annual report.WEIGHT WATCHERS INTERNATIONAL, INC. AND SUBSIDIARIES
NOTES TO CONSOLIDATED FINANCIAL STATEMENTS
(IN THOUSANDS, EXCEPT PER SHARE AMOUNTS)
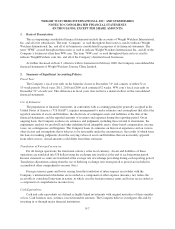
income growth rates for such country and expected future operating income growth rates for such country. The
Company utilizes operating income as the basis for measuring its potential growth because it believes it is the
best indicator of the performance of its business. For fiscal 2011, the blended growth rates used in the
Company’s discounted cash flow analysis ranged from approximately 3% to approximately 20%. For fiscal 2010,
the blended growth rates used in the Company’s discounted cash flow analysis ranged from approximately 5% to
approximately 26%. The Company then discounts the estimated future cash flows utilizing a discount rate. The
discount rate is calculated using the average cost of capital, which includes the cost of equity and the cost of debt.
The cost of equity is determined by combining a risk-free rate of return and a market risk premium. The risk-free
rate of return is generally determined based on the average rate of long-term Treasury securities. The market risk
premium is generally determined by reviewing external market data. When appropriate, the Company further
adjusts the resulting combined rate to account for certain entity-specific factors such as maturity of the market in
order to determine the utilized discount rate. The cost of debt is the Company’s average borrowing rate for the
period. The discount rates used in the Company’s fiscal 2011 year-end impairment test and fiscal 2010 year-end
impairment test averaged approximately 11.3% and 10.5%, respectively.
At the end of fiscal 2011, the Company estimated that approximately 90% of the carrying value of its
franchise rights acquired had a fair value of at least three times their respective carrying amounts. In the United
States, the region which held approximately 86% of the franchise rights acquired, the aggregate fair value of the
Company’s franchise rights acquired was approximately three times the aggregate carrying value. Given that
there is a significant difference between the fair value and carrying value of the Company’s franchise rights
acquired, the Company believes there are currently no reasonably likely changes in assumptions that would cause
an impairment.
The Company expenses all software costs (including website development costs) incurred during the
preliminary project stage and capitalizes all internal and external direct costs of materials and services consumed
in developing software (including website development costs), once the development has reached the application
development stage. Application development stage costs generally include software configuration, coding,
installation to hardware and testing. These costs are amortized over their estimated useful life of 3 years for
website development costs and from 3 to 5 years for all other software costs. All costs incurred for upgrades,
maintenance and enhancements, including the cost of website content, which do not result in additional
functionality, are expensed as incurred.
Revenue Recognition:
WWI earns revenue by conducting meetings, selling products in its meetings and to its franchisees,
collecting commissions from franchisees, collecting royalties related to licensing agreements and selling
advertising space in and copies of its magazines. WWI charges non-refundable registration fees in exchange for
an introductory information session and materials it provides to new members in its meetings business. Revenue
from these registration fees is recognized when the service and products are provided, which is generally at the
same time payment is received from the customer. Revenue from meeting fees, product sales, commissions and
royalties is recognized when services are rendered, products are shipped to customers and title and risk of loss
pass to the customers, and commissions and royalties are earned. Advertising revenue is recognized when
advertisements are published. Revenue from magazine sales is recognized when the magazine is sent to the
customer. Deferred revenue, consisting of prepaid meeting fees, such as Monthly Pass, and magazine
subscription revenue, is amortized into revenue over the period earned. Discounts to customers, including free
registration offers, are recorded as a deduction from gross revenue in the period such revenue was recognized.
F-9


