WeightWatchers 2011 Annual Report Download - page 67
Download and view the complete annual report
Please find page 67 of the 2011 WeightWatchers annual report below. You can navigate through the pages in the report by either clicking on the pages listed below, or by using the keyword search tool below to find specific information within the annual report.-
 1
1 -
2
-
3
-
4
-
5
-
6
-
7
-
8
-
9
-
10
-
11
-
12
-
13
-
14
-
15
-
16
-
17
-
18
-
19
-
20
-
21
-
22
-
23
-
24
-
25
-
26
-
27
-
28
-
29
-
30
-
31
-
32
-
33
-
34
-
35
-
36
-
37
-
38
-
39
-
40
-
41
-
42
-
43
-
44
-
45
-
46
-
47
-
48
-
49
-
50
-
51
-
52
-
53
-
54
-
55
-
56
-
 57
57 -
 58
58 -
 59
59 -
 60
60 -
 61
61 -
 62
62 -
 63
63 -
 64
64 -
 65
65 -
 66
66 -
 67
67 -
 68
68 -
 69
69 -
 70
70 -
 71
71 -
 72
72 -
 73
73 -
 74
74 -
 75
75 -
 76
76 -
 77
77 -
78
-
79
-
80
-
81
-
82
-
83
-
84
-
85
-
86
-
87
-
88
-
89
-
90
-
91
-
92
-
93
-
94
-
95
-
96
-
97
-
98
-
99
-
100
-
101
-
102
-
103
-
104
-
105
-
106
-
107
-
108
-
109
-
110
-
111
-
112
-
113
-
114
-
115
-
116
-
117
-
118
-
119
-
120
-
121
-
122
-
123
-
124
-
125
-
126
-
127
-
128
-
129
-
130
 |
 |

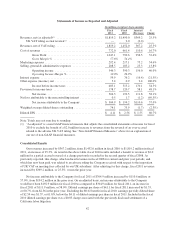
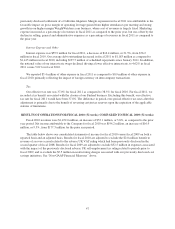
Our fiscal 2010 cost of revenues decreased by 1.4%, or $9.5 million, from $671.0 million in fiscal 2009 to
$661.4 million in fiscal 2010. As previously reported, the Company recorded a charge of $32.5 million in the
fourth quarter of fiscal 2009 related to prior years, as a result of an adverse UK self-employment tax ruling
related to the self-employment status of its UK leaders. As the table above shows, after adjusting fiscal 2009 for
this charge, our cost of revenues in fiscal 2010 would have increased by 3.6% versus fiscal 2009.
Selling, general and administrative expenses were $183.2 million in fiscal 2010, an increase of $12.3
million, or 7.2%, versus fiscal 2009. In fiscal 2009, the Company recorded $5.5 million of restructuring charges
associated with the previously disclosed cost savings initiatives. After excluding the restructuring charges from
fiscal 2009, fiscal 2010 selling, general and administrative expenses would have increased by $17.8 million, or
10.7%, versus fiscal 2009.
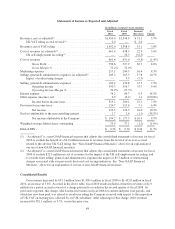
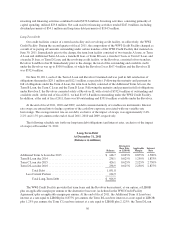
The following summary table sets forth the reconciliation of selected financial data for both fiscal 2010 and
fiscal 2009 on a comparable basis, after the three adjustments noted and discussed above are reflected:
(in millions, except per share amounts)
Revenues,
net
Gross
Profit
Gross
Profit %
Operating
Income
Operating
Income
Margin %
Net Income
Attributable
to Company
Diluted
EPS
Fiscal 2010 ..................... $1,452.0 $790.6 54.4% $390.3 26.9% $194.2 $ 2.56
Adjustments to Reported Amounts
UK VAT Ruling Accrual
Reversal ................. (2.0) (2.0) (2.0) (1.3) (0.02)
Total Adjustments ........ (2.0) (2.0) (2.0) (1.3) (0.02)
Fiscal 2010, as adjusted(1) ......... $1,450.0 $788.6 54.4% $388.3 26.8% $192.9 $ 2.54
Fiscal 2009 ..................... $1,398.9 $727.9 52.0% $356.7 25.5% $177.3 $ 2.30
Adjustments to Reported Amounts
Restructuring Charge ......... — — 5.5 3.3 0.04
UK Self-employment Tax
Ruling ................... — 32.5 32.5 22.7 0.29
Total Adjustments ........ — 32.5 38.0 26.0 0.33
Fiscal 2009, as adjusted(1) ......... $1,398.9 $760.4 54.4% $394.6 28.2% $203.4 $ 2.64
Note: Totals may not sum due to rounding
(1) “As adjusted” is a non-GAAP financial measure that adjusts certain selected financial data for fiscal 2010
and 2009. See “Non-GAAP Financial Measures” above for an explanation of our use of non-GAAP
financial measures.
Net income attributable to the Company for fiscal 2010 of $194.2 million increased by $16.9 million, or
9.5%, from $177.3 million in the prior year period. On an adjusted basis, as noted in the table above, net income
attributable to the Company would have been $192.9 million for fiscal 2010 as compared to $203.4 million for
fiscal 2009, a decrease in 2010 of $10.4 million or 5.1%. Diluted earnings per share of $2.56 for fiscal 2010
increased by $0.26, or 11.3%, from $2.30 in the prior year. After adjusting fiscal 2010 and 2009 for the items as
noted in the table above, diluted earnings per share for fiscal 2010 would have been $2.54, as compared to $2.64
in fiscal 2009, a decrease in 2010 of $0.10 or 3.6% versus the prior year. Included in the fiscal 2010 diluted
earnings per share is a $0.05 charge associated with the settlement of the California labor litigation.
Components of Revenue and Volumes
Fiscal 2010 volume and revenue performance trends improved over the course of the year after a weak first
quarter. The strengthening in performance was driven by the NACO meetings business and accelerating growth
in WeightWatchers.com. Partially offsetting growth in these businesses was weak performance throughout the
year in the UK meetings business and a slowdown in growth in Continental Europe.
49