WeightWatchers 2011 Annual Report Download - page 101
Download and view the complete annual report
Please find page 101 of the 2011 WeightWatchers annual report below. You can navigate through the pages in the report by either clicking on the pages listed below, or by using the keyword search tool below to find specific information within the annual report.-
 1
1 -
2
-
3
-
4
-
5
-
6
-
7
-
8
-
9
-
10
-
11
-
12
-
13
-
14
-
15
-
16
-
17
-
18
-
19
-
20
-
21
-
22
-
23
-
24
-
25
-
26
-
27
-
28
-
29
-
30
-
31
-
32
-
33
-
34
-
35
-
36
-
37
-
38
-
39
-
40
-
41
-
42
-
43
-
44
-
45
-
46
-
47
-
48
-
49
-
50
-
51
-
52
-
53
-
54
-
55
-
56
-
57
-
58
-
59
-
60
-
61
-
62
-
63
-
64
-
65
-
66
-
67
-
68
-
69
-
70
-
71
-
72
-
73
-
74
-
75
-
76
-
77
-
78
-
79
-
80
-
81
-
82
-
83
-
84
-
85
-
86
-
87
-
88
-
89
-
90
-
 91
91 -
 92
92 -
 93
93 -
 94
94 -
 95
95 -
 96
96 -
 97
97 -
 98
98 -
 99
99 -
 100
100 -
 101
101 -
 102
102 -
 103
103 -
 104
104 -
 105
105 -
 106
106 -
 107
107 -
 108
108 -
 109
109 -
 110
110 -
 111
111 -
112
-
113
-
114
-
115
-
116
-
117
-
118
-
119
-
120
-
121
-
122
-
123
-
124
-
125
-
126
-
127
-
128
-
129
-
130
 |
 |

WEIGHT WATCHERS INTERNATIONAL, INC. AND SUBSIDIARIES
NOTES TO CONSOLIDATED FINANCIAL STATEMENTS
(IN THOUSANDS, EXCEPT PER SHARE AMOUNTS)
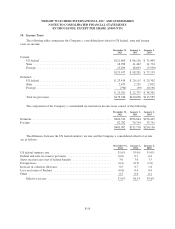
other share-based grants. The maximum number of shares of common stock available for grant under the 1999
Plan was 7,058. The 1999 Plan terminated on December 16, 2009 pursuant to its terms and in connection with
such termination no additional awards can be granted under the plan.
Under the Stock Plans, the Company also grants fully-vested shares of its common stock to certain members
of its Board of Directors. While these shares are fully vested, beginning with stock grants made in the fourth
quarter of 2006, the directors are restricted from selling these shares while they are still serving on the
Company’s Board of Directors. During the fiscal years ended December 31, 2011, January 1, 2011 and
January 2, 2010, the Company granted 13, 19, and 20 fully-vested shares, respectively, and recognized
compensation expense of $772, $595 and $527, respectively.
The Company issues common stock for share-based compensation awards from treasury stock. The total
compensation cost that has been charged against income for these plans was $9,067, $8,612 and $8,796 for the
years ended December 31, 2011, January 1, 2011 and January 2, 2010, respectively. Such amounts have been
included as a component of selling, general and administrative expenses. The total income tax benefit recognized
in the income statement for all share-based compensation arrangements was $2,895, $2,662 and $2,997 for the
years ended December 31, 2011, January 1, 2011 and January 2, 2010, respectively. No compensation costs were
capitalized. As of December 31, 2011, there was $14,494 of total unrecognized compensation cost related to
stock options and RSUs granted under the Stock Plans. That cost is expected to be recognized over a weighted-
average period of approximately 2.0 years.
While the Stock Plans permit various types of awards, other than the aforementioned shares issued to
directors, grants under the plans have historically been either non-qualified stock options or RSUs. The following
describes some further details of these awards.
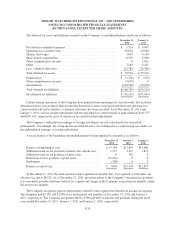
Stock Option Awards
Pursuant to the option components of the Stock Plans, the Company’s Board of Directors authorized the
Company to enter into agreements under which certain employees received stock options. The options are
exercisable based on the terms outlined in the agreements. The options vest over a period of three to five years
and the expiration terms range from five to ten years. Options outstanding at December 31, 2011 have an
exercise price between $4.04 and $79.55 per share.
The fair value of each option award is estimated on the date of grant using the Black-Scholes option pricing
model with the weighted average assumptions noted in the following table. Expected volatility is based on the
historical volatility of the Company’s stock with certain time periods excluded due to historical events which are
not expected to recur. Since the Company’s option exercise history is limited, it has estimated the expected term
of option grants to be the midpoint between the vesting period and the contractual term of each award. The risk
free interest rate is based on the U.S. Treasury yield curve in effect on the date of grant which most closely
corresponds to the expected term of the option. The dividend yield is based on our historic average dividend
yield.
December 31,
2011
January 1,
2011
January 2,
2010
Dividend yield .......................................... 1.8% 1.8% 1.6%
Volatility .............................................. 33.6% 31.4% 31.6%
Risk-free interest rate .................................... 1.5% – 2.8% 2.0% – 3.4% 2.2% – 3.1%
Expected term (years) .................................... 6.5 6.4 6.5
F-17