WeightWatchers 2011 Annual Report Download - page 68
Download and view the complete annual report
Please find page 68 of the 2011 WeightWatchers annual report below. You can navigate through the pages in the report by either clicking on the pages listed below, or by using the keyword search tool below to find specific information within the annual report.-
 1
1 -
2
-
3
-
4
-
5
-
6
-
7
-
8
-
9
-
10
-
11
-
12
-
13
-
14
-
15
-
16
-
17
-
18
-
19
-
20
-
21
-
22
-
23
-
24
-
25
-
26
-
27
-
28
-
29
-
30
-
31
-
32
-
33
-
34
-
35
-
36
-
37
-
38
-
39
-
40
-
41
-
42
-
43
-
44
-
45
-
46
-
47
-
48
-
49
-
50
-
51
-
52
-
53
-
54
-
55
-
56
-
57
-
 58
58 -
 59
59 -
 60
60 -
 61
61 -
 62
62 -
 63
63 -
 64
64 -
 65
65 -
 66
66 -
 67
67 -
 68
68 -
 69
69 -
 70
70 -
 71
71 -
 72
72 -
 73
73 -
 74
74 -
 75
75 -
 76
76 -
 77
77 -
 78
78 -
79
-
80
-
81
-
82
-
83
-
84
-
85
-
86
-
87
-
88
-
89
-
90
-
91
-
92
-
93
-
94
-
95
-
96
-
97
-
98
-
99
-
100
-
101
-
102
-
103
-
104
-
105
-
106
-
107
-
108
-
109
-
110
-
111
-
112
-
113
-
114
-
115
-
116
-
117
-
118
-
119
-
120
-
121
-
122
-
123
-
124
-
125
-
126
-
127
-
128
-
129
-
130
 |
 |
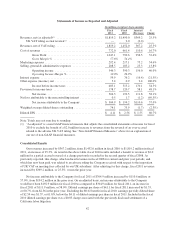
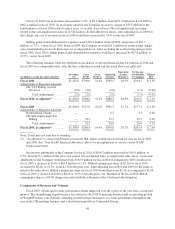
For the full year of fiscal 2010, net revenues were $1,452.0 million, an increase of $53.1 million, or 3.8%,
over $1,398.9 million in the prior fiscal year. After the $2.0 million adjustment to 2010 revenues for the UK
VAT accrual reversal noted in the table and discussions above, fiscal 2010 net revenues were $1,450.0 million,
an increase of 3.7% versus prior year. Favorable foreign currency exchange rates increased our revenues for
fiscal 2010 by $4.0 million, or 0.3%. In the first quarter 2010, adjusted net revenues fell short of first quarter
2009 levels as a result of a combination of factors. In the US and UK meetings businesses, which were cycling
against a prior year innovation, ineffective marketing in the first quarter 2010 failed to draw enrollments into our
meetings, and very poor weather conditions resulted in some meeting closures and lowered the propensity of our
members to attend open meetings in weather-affected areas.
The shortfall in first quarter 2010 net revenues versus the prior year period was more than offset by growth
in net revenues in the last nine months of fiscal 2010 versus the respective prior year period, driven by increases
in the NACO meetings business and WeightWatchers.com, which offset ongoing weakness in the UK meetings
business. A change in marketing strategy in the second quarter 2010 in the NACO meetings business and in the
WeightWatchers.com business spurred an improvement in volume trends in NACO and robust growth in Weight
Watchers Online sign-ups. The improving trend in these two businesses continued throughout the rest of the year,
and was further compounded by the favorable impact on volumes and revenues of the successful launch of our
new programs, PointsPlus and ProPoints, as applicable, in November 2010 in our English-speaking markets.
Meeting Fees
For fiscal 2010, global meeting fees were $819.6 million, an increase of $2.1 million, or 0.3%, from $817.5
million in the prior year period. After the $2.0 million adjustment to 2010 global meeting fees for the UK VAT
accrual reversal noted in the table and discussions above, fiscal 2010 global meeting fees would have been
$817.6 million, up less than $0.1 million versus prior year. Excluding favorable foreign currency exchange rates,
which increased our global meeting fees for fiscal 2010 by $1.8 million, or 0.2%, global meeting fees, as
adjusted for the UK VAT accrual reversal, declined slightly versus prior year by 0.2%. The lack of increase in
global meeting fees on a constant currency basis was the result of weak enrollment early in the year in NACO
meetings and throughout the year in UK meetings, which held full year global meeting paid weeks at virtually the
same level as the prior year, up just 0.4%. In Continental Europe, the launch of our new ProPoints program
innovation at the end of fiscal 2009 resulted in enrollment and meeting fees increases throughout the first half of
fiscal 2010 versus prior year; however, the growth was offset by declines versus prior year in the second half of
fiscal 2010 in this market.
Global meeting paid weeks increased by 0.3 million, or 0.4%, in fiscal 2010 to 87.9 million versus
87.6 million in the prior year period. After a decline of 4.2% in the first quarter 2010 versus first quarter 2009,
global meeting paid weeks performance steadily improved across the rest of the 2010 fiscal year. Versus the prior
year comparable periods, global meeting paid weeks were up 0.8% in the second quarter, 2.6% in the third
quarter, and 3.0% in the fourth quarter, primarily as a result of improvements in the NACO business.
Global attendance in our meetings decreased by 6.1% in fiscal 2010 to 51.0 million from 54.3 million in
fiscal 2009, driven by the 12.0% attendance decline that we experienced in the first quarter 2010 versus the first
quarter 2009. As noted above, extreme weather in many of our geographies in the first quarter 2010 resulted in
some meeting closures and lowered the propensity of our members to attend meetings. In addition, as noted
above, during the first quarter 2010, the US and UK meetings businesses were cycling against a prior year
program innovation. The global attendance decline lessened in the second and third quarters of fiscal 2010 versus
the comparable prior year periods, and nearly achieved parity with the prior year period in the fourth quarter,
down just 0.8% as a result of NACO’s performance.
In NACO, meeting fees for fiscal 2010 were $545.3 million, a decrease of $1.7 million, or 0.3%, from
$547.0 million for fiscal 2009. Full year 2010 NACO meeting paid weeks declined 1.0%, from 55.8 million in
fiscal 2009 to 55.3 million in fiscal 2010, and attendance declined 5.7%, from 32.1 million in fiscal 2009 to
50