WeightWatchers 2011 Annual Report Download - page 72
Download and view the complete annual report
Please find page 72 of the 2011 WeightWatchers annual report below. You can navigate through the pages in the report by either clicking on the pages listed below, or by using the keyword search tool below to find specific information within the annual report.-
 1
1 -
2
-
3
-
4
-
5
-
6
-
7
-
8
-
9
-
10
-
11
-
12
-
13
-
14
-
15
-
16
-
17
-
18
-
19
-
20
-
21
-
22
-
23
-
24
-
25
-
26
-
27
-
28
-
29
-
30
-
31
-
32
-
33
-
34
-
35
-
36
-
37
-
38
-
39
-
40
-
41
-
42
-
43
-
44
-
45
-
46
-
47
-
48
-
49
-
50
-
51
-
52
-
53
-
54
-
55
-
56
-
57
-
58
-
59
-
60
-
61
-
 62
62 -
 63
63 -
 64
64 -
 65
65 -
 66
66 -
 67
67 -
 68
68 -
 69
69 -
 70
70 -
 71
71 -
 72
72 -
 73
73 -
 74
74 -
 75
75 -
 76
76 -
 77
77 -
 78
78 -
 79
79 -
 80
80 -
 81
81 -
 82
82 -
83
-
84
-
85
-
86
-
87
-
88
-
89
-
90
-
91
-
92
-
93
-
94
-
95
-
96
-
97
-
98
-
99
-
100
-
101
-
102
-
103
-
104
-
105
-
106
-
107
-
108
-
109
-
110
-
111
-
112
-
113
-
114
-
115
-
116
-
117
-
118
-
119
-
120
-
121
-
122
-
123
-
124
-
125
-
126
-
127
-
128
-
129
-
130
 |
 |
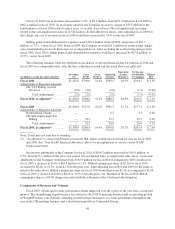
expense associated with the settlement of the California labor litigation. Our operating income margin for fiscal
2010 was 26.9%, an increase of 140 basis points versus 25.5% in fiscal 2009, but a decrease of 140 basis points
when comparing the adjusted 2010 operating income margin of 26.8% to the adjusted 2009 operating income
margin of 28.2%. Of the 140 basis point decrease in adjusted operating income margin, 45 basis points resulted
from the settlement of the California labor litigation. The remainder of the operating income margin decline was
driven by the meetings business and its higher marketing and operating expenses related to the new program
launches, and higher selling, general and administrative expenses. The impact of the decline in operating income
margin in the meetings business was partially offset by operating income margin expansion in the
WeightWatchers.com business.
Interest Expense and Other
Interest expense was $76.2 million for fiscal 2010, an increase of $9.5 million, or 14.2%, from $66.7 million
in fiscal 2009. Higher interest expense was driven by increases in our credit spread resulting from our recent debt
extension and by increases in the average notional value of our interest rate swaps, as well as by higher
amortization of transaction fees. The impact of these factors was partially offset by lower LIBOR and a decrease
in the average debt outstanding in fiscal 2010 versus fiscal 2009. The average credit spread increased from 1.16%
in fiscal 2009 to 1.64% in fiscal 2010. The average notional value of our interest rate swaps increased from
$900.0 million in fiscal 2009 to $1,244.0 million in fiscal 2010. The resultant effective interest rate increased by
84 basis points from 4.17% in fiscal 2009 to 5.01% in fiscal 2010. The average value of debt outstanding
decreased from $1,547.9 million in fiscal 2009 to $1,414.7 million in fiscal 2010.
We reported other expense of $0.9 million in fiscal 2010 as compared to $0.2 million of income in fiscal
2009. Other expense (income) primarily resulted from the impact of foreign currency exchange rates on
intercompany transactions.
Tax
The effective tax rate was 38.5% on our results for fiscal 2010 and 39.8% on our results for fiscal 2009. The
tax rate in fiscal 2009 was inflated due to charges associated with the UK self-employment tax ruling which
resulted in a change in the geographic mix of our taxable income toward higher taxing jurisdictions, notably the
United States. Excluding the impact of the UK self-employment tax ruling, the effective tax rate was 38.7% in
fiscal 2009.
Liquidity and Capital Resources
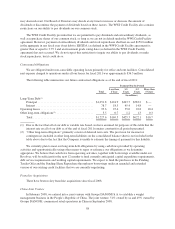
Balance Sheet Working Capital
Comparing our balance sheet at December 31, 2011 with our balance sheet at January 1, 2011, our working
capital deficit decreased by $69.0 million. At December 31, 2011, our working capital deficit was $279.7 million,
including $47.5 million of cash and cash equivalents and $124.9 million of current portion of long-term debt.
This compared to a working capital deficit at January 1, 2011 of $348.7 million, which included $40.5 million of
cash and cash equivalents and $197.5 million of current portion of long-term debt. Excluding the changes in cash
and cash equivalents and the current portion of long-term debt from both periods, the working capital deficit at
December 31, 2011 was $202.2 million, an increase of $10.5 million versus $191.7 million at January 1, 2011.
The $10.5 million growth in the working capital deficit in fiscal 2011 versus the fiscal 2010 level, excluding
the changes in cash and cash equivalents and the current portion of long-term debt, was comprised of increases in
operational and other accrued items in fiscal 2011, partially offset by the decrease in the amount of the swap
liability. The net increase in the working capital deficit in fiscal 2011 versus fiscal 2010 from operational items,
including receivables, inventory, accrued expenses and payables, was $18.9 million. This increase resulted
primarily from the combination of an increase in payables and accrued operating expenses of $25.2 million and a
54