WeightWatchers 2011 Annual Report Download - page 64
Download and view the complete annual report
Please find page 64 of the 2011 WeightWatchers annual report below. You can navigate through the pages in the report by either clicking on the pages listed below, or by using the keyword search tool below to find specific information within the annual report.-
 1
1 -
2
-
3
-
4
-
5
-
6
-
7
-
8
-
9
-
10
-
11
-
12
-
13
-
14
-
15
-
16
-
17
-
18
-
19
-
20
-
21
-
22
-
23
-
24
-
25
-
26
-
27
-
28
-
29
-
30
-
31
-
32
-
33
-
34
-
35
-
36
-
37
-
38
-
39
-
40
-
41
-
42
-
43
-
44
-
45
-
46
-
47
-
48
-
49
-
50
-
51
-
52
-
53
-
 54
54 -
 55
55 -
 56
56 -
 57
57 -
 58
58 -
 59
59 -
 60
60 -
 61
61 -
 62
62 -
 63
63 -
 64
64 -
 65
65 -
 66
66 -
 67
67 -
 68
68 -
 69
69 -
 70
70 -
 71
71 -
 72
72 -
 73
73 -
 74
74 -
75
-
76
-
77
-
78
-
79
-
80
-
81
-
82
-
83
-
84
-
85
-
86
-
87
-
88
-
89
-
90
-
91
-
92
-
93
-
94
-
95
-
96
-
97
-
98
-
99
-
100
-
101
-
102
-
103
-
104
-
105
-
106
-
107
-
108
-
109
-
110
-
111
-
112
-
113
-
114
-
115
-
116
-
117
-
118
-
119
-
120
-
121
-
122
-
123
-
124
-
125
-
126
-
127
-
128
-
129
-
130
 |
 |
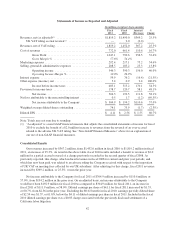
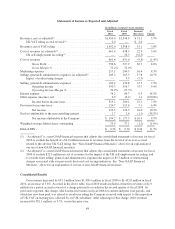
Components of Expenses and Margins
Cost of Revenues and Gross Margin
Total cost of revenues in fiscal 2011 was $772.0 million, an increase of $110.6 million, or 16.7%, from
$661.4 million in the prior year. Cost of revenues grew at a slower rate than net revenues, which increased 25.3%
in fiscal 2011 versus the prior year. We gained operating efficiency versus the prior year because of the increase
in average attendance per meeting and despite higher expenses related to ensuring a successful launch of the new
program innovation in our North American and UK markets. Gross profit for fiscal 2011 of $1,047.1 million
increased $256.5 million, or 32.4%, from $790.6 million in fiscal 2010, and gross margin expanded to 57.6%, an
increase of 310 basis points as compared to 54.4% in fiscal 2010. While operating leverage in the meetings
business was a contributor, the increase in gross margin was largely the result of the higher margin
WeightWatchers.com business, where cost of revenues is largely fixed, becoming a larger component of our
revenue mix.
Marketing
Marketing expenses for fiscal 2011 were $292.4 million, an increase of $75.2 million, or 34.6%, versus
fiscal 2010, or 32.5% on a constant currency basis. Included in our fiscal 2011 marketing expense was a first
time significant investment in marketing the Weight Watchers Online product to men. This new initiative in
fiscal 2011, which focused on building awareness and communicating the relevance of the Weight Watchers
brand to the male demographic, accounted for 8.2% of the increase in marketing expenses in fiscal 2011 versus
the prior year. In addition, we increased our marketing investment in the second and third quarters of fiscal 2011
to support our new program launches and to strengthen recruitment growth during our spring and fall marketing
campaigns. This strategy proved to be efficient and successful in driving recruitment of both new and rejoining
meeting members and Online subscribers. In the fourth quarter of fiscal 2011, we increased our global spend in
the last week of the year in support of our winter 2012 marketing campaigns. In addition, we opportunistically
added marketing in the second quarter of fiscal 2011 to leverage positive public relations, such as our ranking as
the number one weight-loss diet by U.S. News & World Report magazine.
Notwithstanding all of these strategies and initiatives, our marketing acquisition cost per customer declined
by 1.7%, or 3.2% on a constant currency basis, in fiscal 2011 versus the prior year. Our marketing expenses as a
percentage of revenues were 16.1% in fiscal 2011 as compared to 15.0% in the prior year, as the revenues from
more recent customer acquisitions will accrue over future periods.
Selling, General and Administrative
Selling, general and administrative expenses were $208.5 million for fiscal 2011 versus $183.2 million for
fiscal 2010, an increase of $25.3 million, or 13.8%. On a constant currency basis, selling, general and
administrative expenses for fiscal 2011 increased by 11.2% versus fiscal 2010. The largest component of the
increase was salary related, reflecting higher bonus expense associated with our strong business performance in
fiscal 2011. In addition, fiscal 2011 included expense related to growth initiatives including new business
development and technology for the development of our mobile platforms. Selling, general and administrative
expenses as a percentage of revenues for fiscal 2011 decreased by 120 basis points to 11.5% from 12.6% for
fiscal 2010. It should be noted that fiscal 2010 included $4.9 million of selling, general and administrative
expense associated with the previously disclosed settlement of a California litigation, which accounted for 34
basis points of the 120 basis point decrease in selling, general and administrative expenses as a percentage of
revenues when comparing fiscal 2011 to the prior year.
Operating Income Margin
Our operating income margin in fiscal 2011 increased to 30.0%, up 310 basis points from 26.9% in fiscal
2010. Our operating income margin in fiscal 2010 decreased by 45 basis points as a result of the $6.5 million
charge, included in both cost of revenues and selling, general and administrative expense, associated with the
46