WeightWatchers 2011 Annual Report Download - page 71
Download and view the complete annual report
Please find page 71 of the 2011 WeightWatchers annual report below. You can navigate through the pages in the report by either clicking on the pages listed below, or by using the keyword search tool below to find specific information within the annual report.-
 1
1 -
2
-
3
-
4
-
5
-
6
-
7
-
8
-
9
-
10
-
11
-
12
-
13
-
14
-
15
-
16
-
17
-
18
-
19
-
20
-
21
-
22
-
23
-
24
-
25
-
26
-
27
-
28
-
29
-
30
-
31
-
32
-
33
-
34
-
35
-
36
-
37
-
38
-
39
-
40
-
41
-
42
-
43
-
44
-
45
-
46
-
47
-
48
-
49
-
50
-
51
-
52
-
53
-
54
-
55
-
56
-
57
-
58
-
59
-
60
-
 61
61 -
 62
62 -
 63
63 -
 64
64 -
 65
65 -
 66
66 -
 67
67 -
 68
68 -
 69
69 -
 70
70 -
 71
71 -
 72
72 -
 73
73 -
 74
74 -
 75
75 -
 76
76 -
 77
77 -
 78
78 -
 79
79 -
 80
80 -
 81
81 -
82
-
83
-
84
-
85
-
86
-
87
-
88
-
89
-
90
-
91
-
92
-
93
-
94
-
95
-
96
-
97
-
98
-
99
-
100
-
101
-
102
-
103
-
104
-
105
-
106
-
107
-
108
-
109
-
110
-
111
-
112
-
113
-
114
-
115
-
116
-
117
-
118
-
119
-
120
-
121
-
122
-
123
-
124
-
125
-
126
-
127
-
128
-
129
-
130
 |
 |
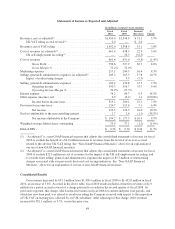
and fiscal 2010 cost of revenues would have increased by $22.9 million, or 3.6%, versus the prior year. The 2010
cost of revenues overall increased versus the prior year at the same rate as revenues. In the meetings business,
however, growth in the cost of revenues exceeded revenue growth. This was primarily the result of two factors,
both related to the launch of our new programs in the English speaking markets. First was the incremental cost of
providing new program materials to all of our meeting attendees in replacement of materials from the old
program. Second was the higher cost of in-meeting products relative to revenue as a result of discounting, both
prior to the innovation launches to clear inventory and during the launches to encourage the purchase of
enrollment-related products. As indicated above in our discussion of in-meeting product sales, these discounting
strategies were nevertheless successful in driving in-meeting product sales per attendee.
Gross profit for fiscal 2010 of $790.6 million, increased $62.7 million, or 8.6%, from $727.9 million in
fiscal 2009, but after the adjustment to 2010 gross profit for the UK VAT accrual reversal and the adjustment to
2009 for the UK leader self-employment tax ruling, fiscal 2010 gross profit would have been $788.6 million, an
increase of 3.7% versus $760.4 million in the prior year. The Company’s gross margin was 54.4% in fiscal 2010
as compared to 52.0% in fiscal 2009, but after the UK VAT accrual reversal and UK self-employment tax ruling
adjustments, the comparable gross margin in both years was 54.4%. WeightWatchers.com grew its gross margin
in fiscal 2010 versus fiscal 2009 due to the strong revenue growth in that business, coupled with low incremental
variable costs. Robust growth in WeightWatchers.com was offset by a decline in gross margin in the meetings
business, for the reasons related to the new program launches noted in the above description of cost of revenues.
Marketing
Marketing expenses for fiscal 2010 of $217.1 million increased from the fiscal 2009 level of $200.5 million
by 8.3%, but on a constant currency basis, fiscal 2010 marketing expenses increased by 7.3%, or $14.6 million,
versus the prior year. After disappointing results from our first quarter marketing, we adopted a new marketing
strategy focused on member experience in both the NACO meetings business, featuring Jennifer Hudson, and in
the WeightWatchers.com business. As the success of this strategy became apparent, we increased our marketing
investments in these businesses, resulting in improved recruitment trends in NACO and a strengthening of
already robust growth in Online sign-ups. In the first half of fiscal 2010, global marketing expenses increased by
2.7% versus the prior year period, while in the second half of 2010, we increased marketing expenditures versus
the prior year period by 18.2%. Part of the second half of fiscal 2010 increase is attributable to end of year
spending for the January 2011 launch of the new PointsPlus program in NACO. Marketing expenses as a
percentage of revenues were 15.0% in fiscal 2010 as compared to 14.3% in the prior year period.
Selling, General and Administrative
Selling, general and administrative expenses were $183.2 million for fiscal 2010 versus $170.8 million for
fiscal 2009, an increase of $12.3 million, or 7.2%. On a constant currency basis and after adjusting fiscal 2009 to
exclude restructuring charges as noted in the table and discussions above, fiscal 2010 selling, general and
administrative expenses increased by 10.2%, or $16.9 million, versus $165.3 million in fiscal 2009. The increase
was driven primarily by expenses related to the settlement of the California labor litigation, consulting fees
associated with business development, and technology-related expenses, including for the development of mobile
applications. Selling, general and administrative expenses as a percentage of revenues for fiscal 2010 were 12.6%
and for fiscal 2009 were 12.2%, or 11.8% on an as adjusted basis.
Operating Income Margin
Our operating income for fiscal 2010 was $390.3 million, an increase of $33.7 million, or 9.4%, from
$356.7 million in fiscal 2009. After adjusting fiscal 2010 to exclude the revenue benefit of the UK VAT reversal,
and fiscal 2009 to exclude restructuring charges and the impact of the UK self-employment tax ruling, adjusted
operating income would have been $388.3 million in fiscal 2010 and $394.6 million in fiscal 2009. The decrease
in operating income on this adjusted basis would have been $6.2 million, or 1.6%, including $6.5 million of
53