WeightWatchers 2011 Annual Report Download - page 65
Download and view the complete annual report
Please find page 65 of the 2011 WeightWatchers annual report below. You can navigate through the pages in the report by either clicking on the pages listed below, or by using the keyword search tool below to find specific information within the annual report.-
 1
1 -
2
-
3
-
4
-
5
-
6
-
7
-
8
-
9
-
10
-
11
-
12
-
13
-
14
-
15
-
16
-
17
-
18
-
19
-
20
-
21
-
22
-
23
-
24
-
25
-
26
-
27
-
28
-
29
-
30
-
31
-
32
-
33
-
34
-
35
-
36
-
37
-
38
-
39
-
40
-
41
-
42
-
43
-
44
-
45
-
46
-
47
-
48
-
49
-
50
-
51
-
52
-
53
-
54
-
 55
55 -
 56
56 -
 57
57 -
 58
58 -
 59
59 -
 60
60 -
 61
61 -
 62
62 -
 63
63 -
 64
64 -
 65
65 -
 66
66 -
 67
67 -
 68
68 -
 69
69 -
 70
70 -
 71
71 -
 72
72 -
 73
73 -
 74
74 -
 75
75 -
76
-
77
-
78
-
79
-
80
-
81
-
82
-
83
-
84
-
85
-
86
-
87
-
88
-
89
-
90
-
91
-
92
-
93
-
94
-
95
-
96
-
97
-
98
-
99
-
100
-
101
-
102
-
103
-
104
-
105
-
106
-
107
-
108
-
109
-
110
-
111
-
112
-
113
-
114
-
115
-
116
-
117
-
118
-
119
-
120
-
121
-
122
-
123
-
124
-
125
-
126
-
127
-
128
-
129
-
130
 |
 |
previously disclosed settlement of a California litigation. Margin expansion in fiscal 2011 was attributable to the
favorable impact on gross margin of operating leverage gained from higher attendances per meeting and strong
growth in our higher margin WeightWatchers.com business, where cost of revenues is largely fixed. Marketing
expense increased as a percentage of revenues in fiscal 2011 as compared to the prior year, but was offset by the
decline in selling, general and administrative expenses as a percentage of revenues in fiscal 2011 as compared to
the prior year.
Interest Expense and Other
Interest expense was $59.9 million for fiscal 2011, a decrease of $16.4 million, or 21.5%, from $76.2
million in fiscal 2010. Our average debt outstanding decreased in fiscal 2011 to $1,183 million as compared to
$1,415 million in fiscal 2010, including $197.5 million of scheduled repayments since January 2011. In addition,
the notional value of our interest rate swaps declined, driving a lower effective interest rate, to 4.62% in fiscal
2011 versus 5.01% in fiscal 2010.
We reported $3.4 million of other expense in fiscal 2011 as compared to $0.9 million of other expense in
fiscal 2010, primarily reflecting the impact of foreign currency on intercompany transactions.
Tax
Our effective tax rate was 37.0% for fiscal 2011 as compared to 38.5% for fiscal 2010. For fiscal 2011, we
recorded a tax benefit associated with the closure of our Finland business. Excluding this benefit, our effective
tax rate for fiscal 2011 would have been 37.8%. The difference in period-over-period effective tax rates after this
adjustment is primarily due to the benefit of reversing certain tax reserves upon the expiration of the applicable
statutes of limitations.
RESULTS OF OPERATIONS FOR FISCAL 2010 (52 weeks) COMPARED TO FISCAL 2009 (52 weeks)
Fiscal 2010 revenues were $1,452.0 million, an increase of $53.1 million, or 3.8%, as compared to the prior
year period. Net income attributable to the Company for fiscal 2010 was $194.2 million, an increase of $16.9
million, or 9.5%, from $177.3 million for the prior year period.
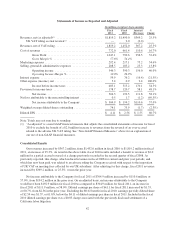
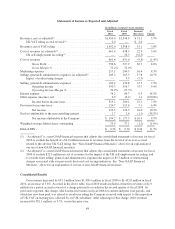
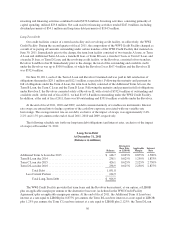
The table below shows our consolidated statements of income for fiscal 2010 versus fiscal 2009 on both a
reported basis and an adjusted basis. Results for fiscal 2010 are adjusted to exclude the $2.0 million benefit to
revenue of an over-accrual related to the adverse UK VAT ruling which had been previously disclosed in the
second quarter of fiscal 2008. Results for fiscal 2009 are adjusted to exclude $32.5 million in expenses associated
with the impact of the previously disclosed adverse UK self-employment tax ruling related to periods prior to
fiscal 2009, and to exclude the $5.5 million in restructuring charges associated with our previously disclosed cost
savings initiatives. See “Non-GAAP Financial Measures” above.
47